Prediction of the gene expressions after a knock-out experience predict
Source: R/micro_array-network.R
predict-micro_array-method.RdPrediction of the gene expressions after a knock-out experience
Usage
# S4 method for class 'micro_array'
predict(object, Omega, nv = 0, targets = NULL, adapt = TRUE)References
Jung, N., Bertrand, F., Bahram, S., Vallat, L., and Maumy-Bertrand, M. (2014). Cascade: a R-package to study, predict and simulate the diffusion of a signal through a temporal gene network. Bioinformatics, btt705.
Vallat, L., Kemper, C. A., Jung, N., Maumy-Bertrand, M., Bertrand, F., Meyer, N., ... & Bahram, S. (2013). Reverse-engineering the genetic circuitry of a cancer cell with predicted intervention in chronic lymphocytic leukemia. Proceedings of the National Academy of Sciences, 110(2), 459-464.
Examples
data(Selection)
data(network)
#A nv value can chosen using the cutoff function
nv=.11
EGR1<-which(match(Selection@name,"EGR1")==1)
P<-position(network,nv=nv)
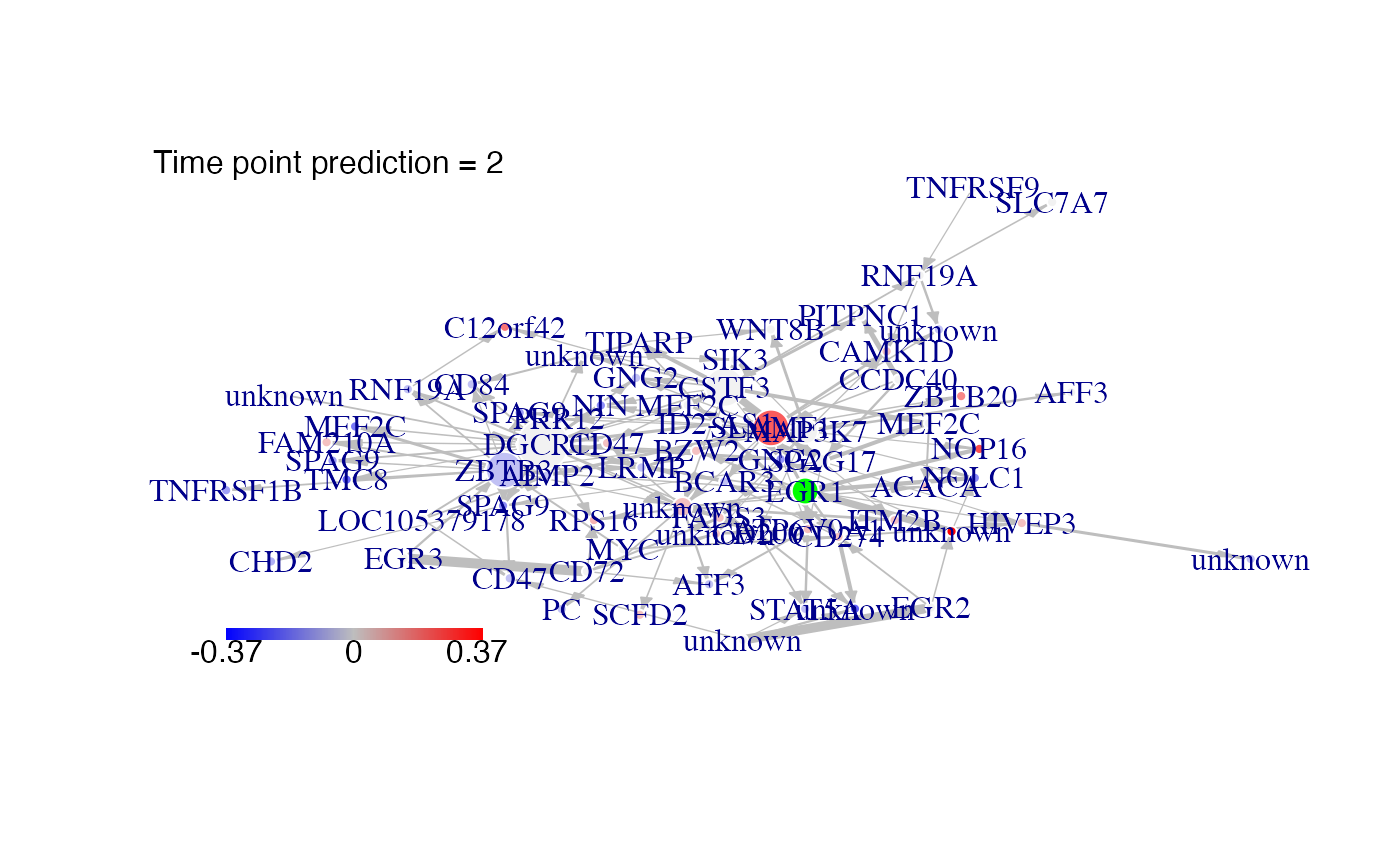
#We predict gene expression modulations within the network if EGR1 is experimentaly knocked-out.
prediction_ko5<-predict(Selection,network,nv=nv,targets=EGR1)
#Then we plot the results. Here for example we see changes at time point t2:
plot(prediction_ko5,time=2,ini=P,label_v=Selection@name)