The graphical output will differ according to the option used.
Usage
plotF(x, choice = "Fshape", nround = 2, pixmap.color = terrain.colors(20))Examples
#For numerical/inferred F matrices
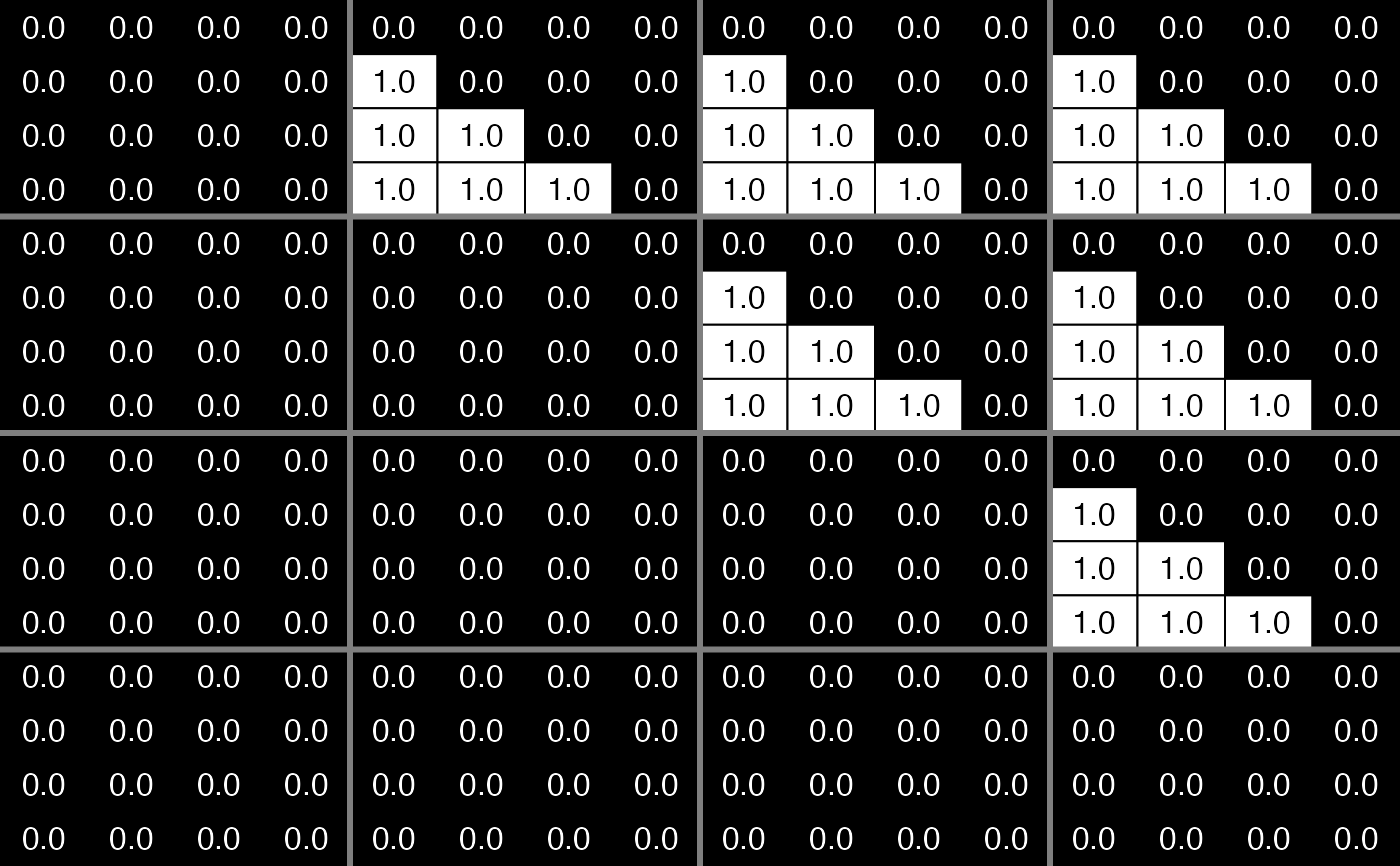
plotF(CascadeFinit(4,4),choice="F", nround=1)
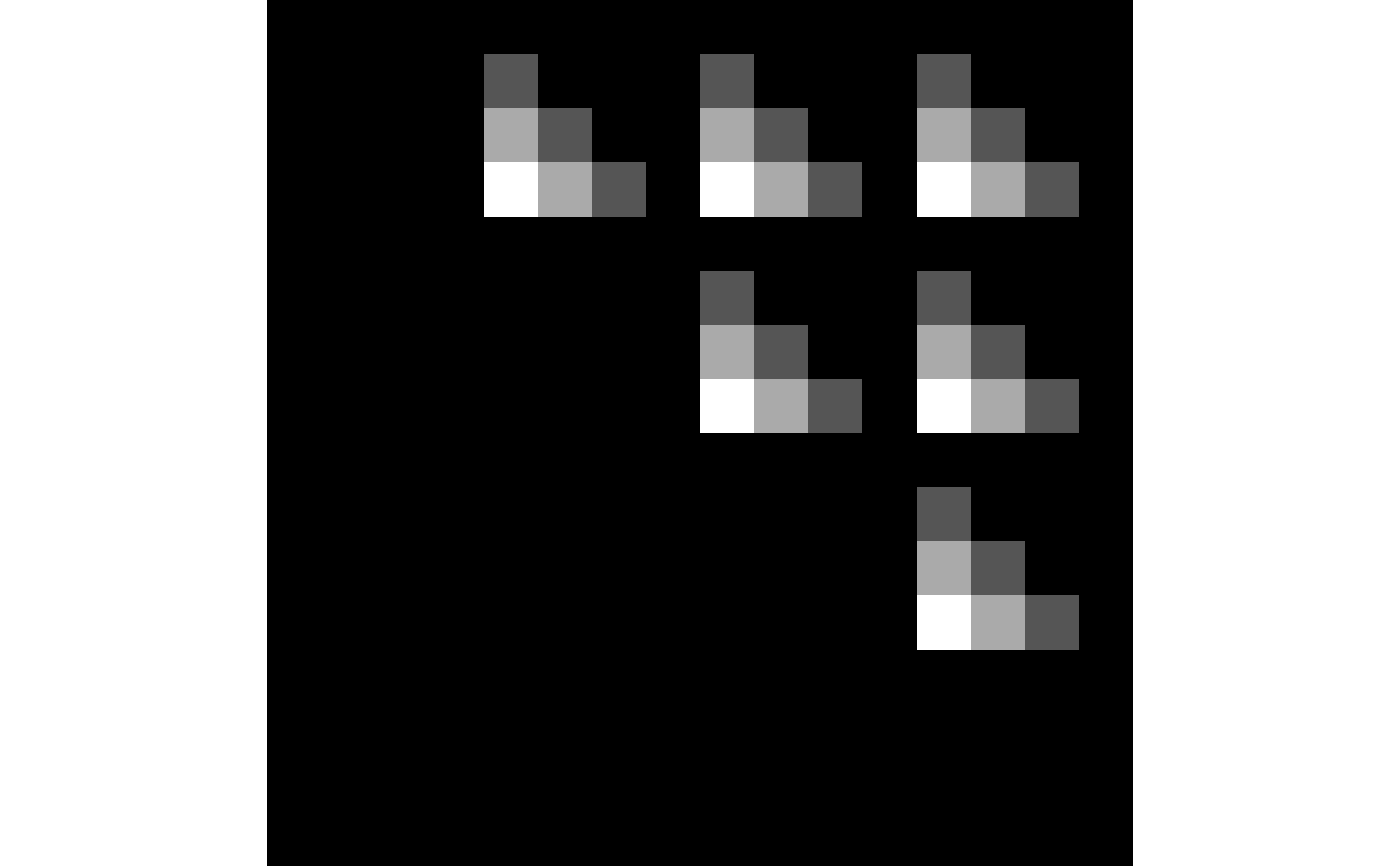
 if (requireNamespace("pixmap", quietly = TRUE)) {
plotF(CascadeFinit(4,4),choice="Fpixmap")
} else {
plotF(CascadeFinit(4,4),choice="F", nround=1)
}
if (requireNamespace("pixmap", quietly = TRUE)) {
plotF(CascadeFinit(4,4),choice="Fpixmap")
} else {
plotF(CascadeFinit(4,4),choice="F", nround=1)
}
 #For theoritical F matrices
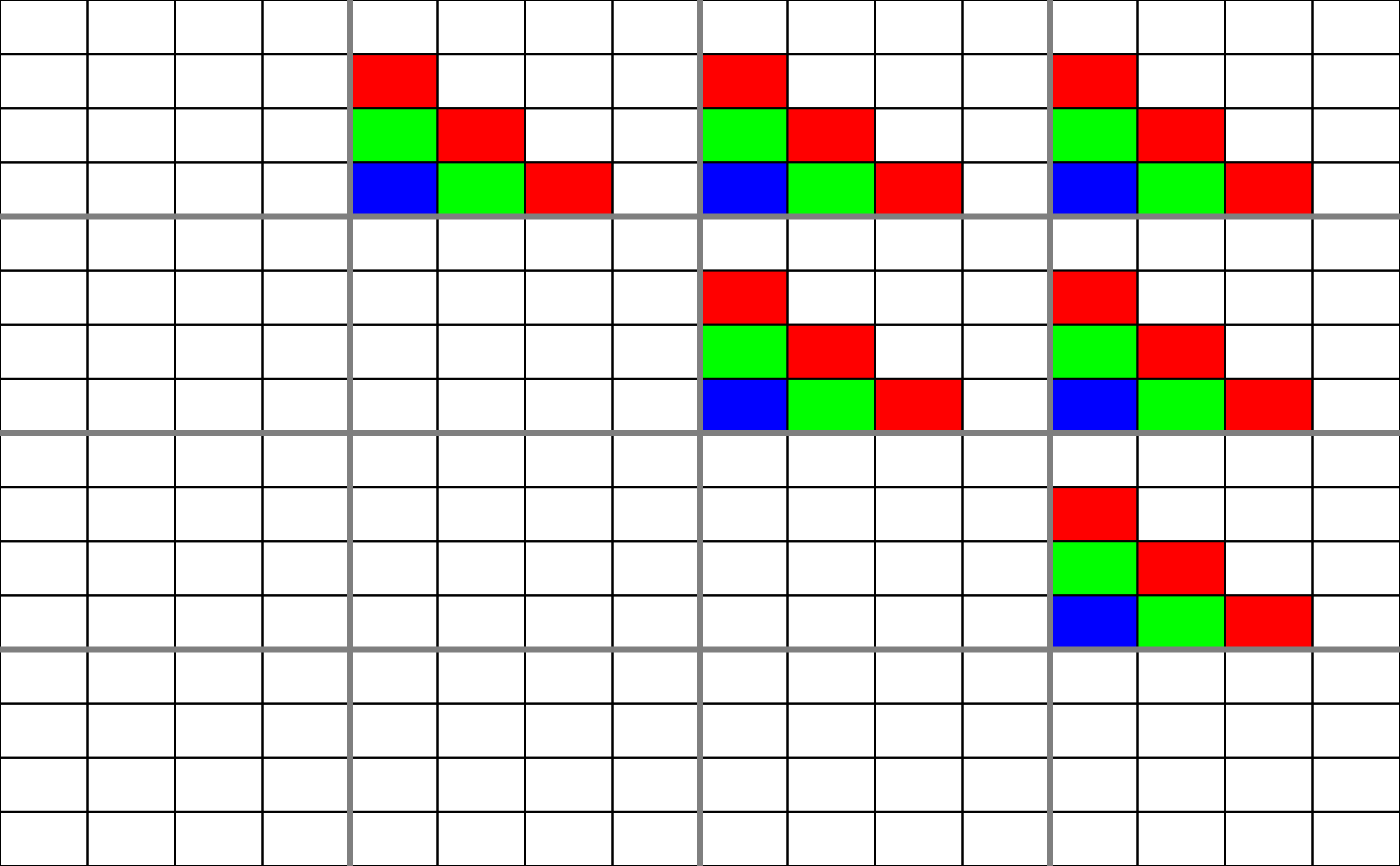
plotF(CascadeFshape(4,4),choice="Fshape")
#For theoritical F matrices
plotF(CascadeFshape(4,4),choice="Fshape")
 if (requireNamespace("pixmap", quietly = TRUE)) {
plotF(CascadeFshape(4,4),choice="Fshapepixmap")
} else {
plotF(CascadeFshape(4,4),choice="Fshape")
}
if (requireNamespace("pixmap", quietly = TRUE)) {
plotF(CascadeFshape(4,4),choice="Fshapepixmap")
} else {
plotF(CascadeFshape(4,4),choice="Fshape")
}