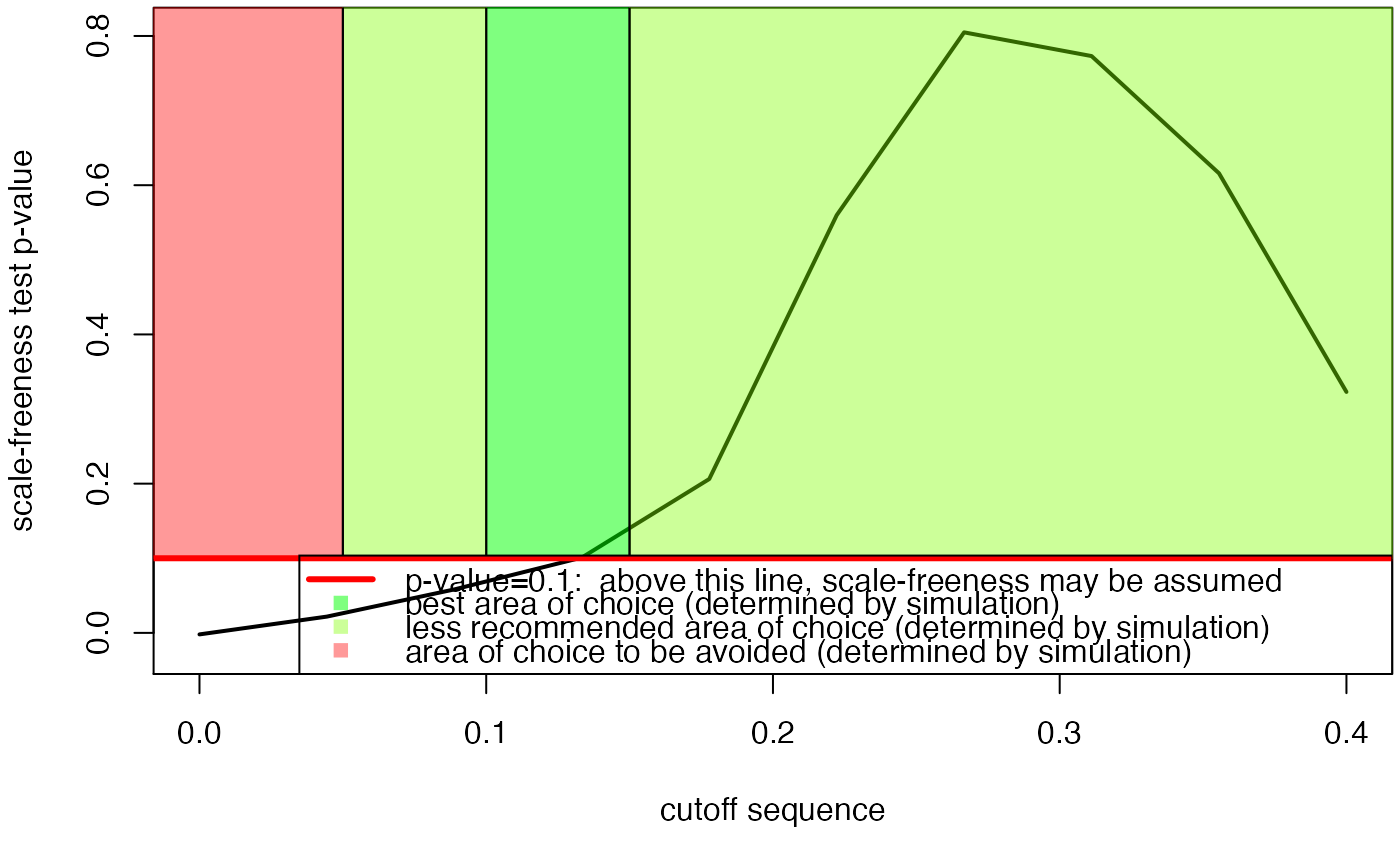
Allows estimating the best cutoff, in function of the scale-freeness of the network. For a sequence of cutoff, the corresponding p-value is then calculated.
Value
A list containing two objects :
- p.value
the p values corresponding to the sequence of cutoff
- p.value.inter
the smoothed p value vector, using the loess function
References
Jung, N., Bertrand, F., Bahram, S., Vallat, L., and Maumy-Bertrand, M. (2014). Cascade: a R-package to study, predict and simulate the diffusion of a signal through a temporal gene network. Bioinformatics, btt705.
Vallat, L., Kemper, C. A., Jung, N., Maumy-Bertrand, M., Bertrand, F., Meyer, N., ... & Bahram, S. (2013). Reverse-engineering the genetic circuitry of a cancer cell with predicted intervention in chronic lymphocytic leukemia. Proceedings of the National Academy of Sciences, 110(2), 459-464.
Examples
# \donttest{
  data(network)
  cutoff(network)
#> [1] "This calculation may be long"
#> [1] "1/10"
#> [1] "2/10"
#> [1] "3/10"
#> [1] "4/10"
#> [1] "5/10"
#> [1] "6/10"
#> [1] "7/10"
#> [1] "8/10"
#> [1] "9/10"
#> [1] "10/10"
#>  [1] 0.000 0.001 0.127 0.122 0.089 0.566 0.867 0.671 0.595 0.332

#> $p.value
#>  [1] 0.000 0.001 0.127 0.122 0.089 0.566 0.867 0.671 0.595 0.332
#>
#> $p.value.inter
#>  [1] -0.001490825  0.025014232  0.057341190  0.088355340  0.183669112
#>  [6]  0.537769423  0.794451285  0.768411316  0.611308228  0.312285009
#>
#> $sequence
#>  [1] 0.00000000 0.04444444 0.08888889 0.13333333 0.17777778 0.22222222
#>  [7] 0.26666667 0.31111111 0.35555556 0.40000000
#>
  #See vignette for more details
# }
#> $p.value
#> [1] 0.000 0.001 0.127 0.122 0.089 0.566 0.867 0.671 0.595 0.332
#>
#> $p.value.inter
#> [1] -0.001490825 0.025014232 0.057341190 0.088355340 0.183669112
#> [6] 0.537769423 0.794451285 0.768411316 0.611308228 0.312285009
#>
#> $sequence
#> [1] 0.00000000 0.04444444 0.08888889 0.13333333 0.17777778 0.22222222
#> [7] 0.26666667 0.31111111 0.35555556 0.40000000
#>
#See vignette for more details
# }