Selection of differentially expressed genes.
Usage
# S4 method for class 'micro_array,micro_array,numeric'
geneSelection(
  x,
  y,
  tot.number,
  data_log = TRUE,
  wanted.patterns = NULL,
  forbidden.patterns = NULL,
  peak = NULL,
  alpha = 0.05,
  Design = NULL,
  lfc = 0
)

# S4 method for class 'list,list,numeric'
geneSelection(
  x,
  y,
  tot.number,
  data_log = TRUE,
  alpha = 0.05,
  cont = FALSE,
  lfc = 0,
  f.asso = NULL
)

# S4 method for class 'micro_array,numeric'
genePeakSelection(
  x,
  peak,
  y = NULL,
  data_log = TRUE,
  durPeak = c(1, 1),
  abs_val = TRUE,
  alpha_diff = 0.05
)
Arguments
- x
either a micro_array object or a list of micro_array objects. In the first case, the micro_array object represents the stimulated measurements. In the second case, the control unstimulated data (if present) should be the first element of the list.
- y
either a micro_array object or a list of strings. In the first case, the micro_array object represents the stimulated measurements. In the second case, the list is the way to specify the contrast:
- First element:
condition, condition&time or pattern. The condition specification is used when the overall is to compare two conditions. The condition&time specification is used when comparing two conditions at two precise time points. The pattern specification allows to decide which time point should be differentially expressed.
- Second element:
a vector of length 2. The two conditions which should be compared. If a condition is used as control, it should be the first element of the vector. However, if this control is not measured throught time, the option cont=TRUE should be used.
- Third element:
depends on the first element. It is no needed if condition has been specified. If condition&time has been specified, then this is a vector containing the time point at which the comparison should be done. If pattern has been specified, then this is a vector of 0 and 1 of length T, where T is the number of time points. The time points with desired differential expression are provided with 1.
- tot.number
an integer. The number of selected genes. If tot.number <0 all differentially genes are selected. If tot.number > 1, tot.number is the maximum of diffenrtially genes that will be selected. If 0<tot.number<1, tot.number represents the proportion of diffenrentially genes that are selected.
- data_log
logical (default to TRUE); should data be logged ?
- wanted.patterns
a matrix with wanted patterns [only for geneSelection].
- forbidden.patterns
a matrix with forbidden patterns [only for geneSelection].
- peak
interger. At which time points measurements should the genes be selected [optionnal for geneSelection].
- alpha
float; the risk level. Default to `alpha=0.05`
- Design
the design matrix of the experiment. Defaults to `NULL`.
- lfc
log fold change value used in limma's `topTable`. Defaults to 0.
- cont
use contrasts. Defaults to `FALSE`.
- f.asso
function used to assess the association between the genes. The default value `NULL` implies the use of the usual `mean` function.
- durPeak
vector of size 2 (default to c(1,1)) ; the first elements gives the length of the peak at the left, the second at the right. [only for genePeakSelection]
- abs_val
logical (default to TRUE) ; should genes be selected on the basis of their absolute value expression ? [only for genePeakSelection]
- alpha_diff
float; the risk level
References
Jung, N., Bertrand, F., Bahram, S., Vallat, L., and Maumy-Bertrand, M. (2014). Cascade: a R-package to study, predict and simulate the diffusion of a signal through a temporal gene network. Bioinformatics, btt705.
Vallat, L., Kemper, C. A., Jung, N., Maumy-Bertrand, M., Bertrand, F., Meyer, N., ... & Bahram, S. (2013). Reverse-engineering the genetic circuitry of a cancer cell with predicted intervention in chronic lymphocytic leukemia. Proceedings of the National Academy of Sciences, 110(2), 459-464.
Examples
# \donttest{
if(require(CascadeData)){
data(micro_US)
micro_US<-as.micro_array(micro_US,time=c(60,90,210,390),subject=6)
data(micro_S)
micro_S<-as.micro_array(micro_S,time=c(60,90,210,390),subject=6)
#Basically, to find the 50 more significant expressed genes you will use:
Selection_1<-geneSelection(x=micro_S,y=micro_US,
tot.number=50,data_log=TRUE)
summary(Selection_1)
#If we want to select genes that are differentially
#at time t60 or t90 :
Selection_2<-geneSelection(x=micro_S,y=micro_US,tot.number=30,
wanted.patterns=
rbind(c(0,1,0,0),c(1,0,0,0),c(1,1,0,0)))
summary(Selection_2)
#To select genes that have a differential maximum of expression at a specific time point.
Selection_3<-genePeakSelection(x=micro_S,y=micro_US,peak=1,
abs_val=FALSE,alpha_diff=0.01)
summary(Selection_3)
}
#> Loading required package: limma
#> Warning: package ‘limma’ was built under R version 4.5.1
#> US60 US90 US210 US390
#> Min. :-0.44125 Min. :-0.8100 Min. :-1.560 Min. :-1.0414
#> 1st Qu.:-0.08878 1st Qu.:-0.1214 1st Qu.: 1.178 1st Qu.: 0.7883
#> Median : 0.06389 Median : 0.0170 Median : 1.537 Median : 1.2396
#> Mean : 0.29793 Mean : 0.3231 Mean : 1.509 Mean : 1.1426
#> 3rd Qu.: 0.18056 3rd Qu.: 0.1667 3rd Qu.: 1.919 3rd Qu.: 1.5070
#> Max. : 2.86440 Max. : 4.2847 Max. : 3.673 Max. : 4.6843
#> US60 US90 US210 US390
#> Min. :-0.9303 Min. :-0.12274 Min. :-1.2161 Min. :-0.9591
#> 1st Qu.:-0.4365 1st Qu.: 0.05945 1st Qu.: 0.8696 1st Qu.: 0.4383
#> Median :-0.2202 Median : 0.15432 Median : 1.1855 Median : 0.7457
#> Mean :-0.1439 Mean : 0.43625 Mean : 1.2308 Mean : 0.7790
#> 3rd Qu.:-0.0282 3rd Qu.: 0.29036 3rd Qu.: 1.6403 3rd Qu.: 1.0575
#> Max. : 2.0267 Max. : 3.37588 Max. : 2.6157 Max. : 4.6113
#> US60 US90 US210 US390
#> Min. :-0.62452 Min. :-0.53921 Min. :-1.653 Min. :-1.611
#> 1st Qu.:-0.03412 1st Qu.:-0.03297 1st Qu.: 1.402 1st Qu.: 0.812
#> Median : 0.06132 Median : 0.09073 Median : 1.779 Median : 1.091
#> Mean : 0.34579 Mean : 0.68574 Mean : 1.836 Mean : 1.075
#> 3rd Qu.: 0.13643 3rd Qu.: 0.77977 3rd Qu.: 2.231 3rd Qu.: 1.412
#> Max. : 3.31723 Max. : 4.36037 Max. : 4.271 Max. : 4.506
#> US60 US90 US210 US390
#> Min. :-0.33647 Min. :-0.46488 Min. :-0.8332 Min. :-0.5609
#> 1st Qu.:-0.02169 1st Qu.:-0.06483 1st Qu.: 0.7915 1st Qu.: 0.4747
#> Median : 0.04853 Median : 0.04034 Median : 1.0525 Median : 0.6206
#> Mean : 0.22706 Mean : 0.44077 Mean : 1.1166 Mean : 0.7000
#> 3rd Qu.: 0.18651 3rd Qu.: 0.59738 3rd Qu.: 1.4347 3rd Qu.: 0.8204
#> Max. : 1.82903 Max. : 3.60640 Max. : 2.9587 Max. : 3.2116
#> US60 US90 US210 US390
#> Min. :-0.46722 Min. :-0.46073 Min. :-1.0271 Min. :-1.0395
#> 1st Qu.:-0.17848 1st Qu.:-0.02118 1st Qu.: 0.8441 1st Qu.: 0.4687
#> Median :-0.09357 Median : 0.13574 Median : 1.2569 Median : 0.7384
#> Mean : 0.13903 Mean : 0.47404 Mean : 1.2451 Mean : 0.7381
#> 3rd Qu.: 0.04130 3rd Qu.: 0.60663 3rd Qu.: 1.7215 3rd Qu.: 0.9835
#> Max. : 2.31074 Max. : 3.24454 Max. : 2.5446 Max. : 3.4299
#> US60 US90 US210 US390
#> Min. :-0.19230 Min. :-0.688731 Min. :-1.472 Min. :-1.2069
#> 1st Qu.:-0.02128 1st Qu.: 0.009111 1st Qu.: 1.100 1st Qu.: 0.5209
#> Median : 0.02499 Median : 0.176150 Median : 1.419 Median : 0.8359
#> Mean : 0.37176 Mean : 0.566765 Mean : 1.391 Mean : 0.8804
#> 3rd Qu.: 0.12327 3rd Qu.: 0.828888 3rd Qu.: 1.858 3rd Qu.: 1.2084
#> Max. : 3.16035 Max. : 3.199747 Max. : 2.803 Max. : 4.1558
 #> US60 US90 US210 US390
#> Min. :-2.5257 Min. :-2.3695 Min. :-2.2557 Min. :-1.63142
#> 1st Qu.:-1.6127 1st Qu.:-0.2866 1st Qu.:-0.2105 1st Qu.:-0.20828
#> Median :-0.3778 Median : 0.6600 Median : 0.1241 Median :-0.09562
#> Mean :-0.5575 Mean : 0.3237 Mean : 0.2928 Mean :-0.02706
#> 3rd Qu.: 0.2975 3rd Qu.: 0.8961 3rd Qu.: 0.6911 3rd Qu.: 0.23099
#> Max. : 2.3763 Max. : 2.4655 Max. : 2.1848 Max. : 0.78412
#> US60 US90 US210 US390
#> Min. :-2.7932 Min. :-2.492454 Min. :-2.61740 Min. :-1.67813
#> 1st Qu.:-0.9423 1st Qu.:-0.201708 1st Qu.:-0.26291 1st Qu.:-0.43358
#> Median :-0.3059 Median :-0.009419 Median : 0.06493 Median : 0.00995
#> Mean :-0.3262 Mean : 0.265084 Mean :-0.02941 Mean :-0.03069
#> 3rd Qu.: 0.1071 3rd Qu.: 0.620449 3rd Qu.: 0.28656 3rd Qu.: 0.21746
#> Max. : 2.2920 Max. : 5.318566 Max. : 1.28785 Max. : 2.83321
#> US60 US90 US210 US390
#> Min. :-2.9444 Min. :-0.9721 Min. :-1.5506 Min. :-1.682560
#> 1st Qu.:-1.1363 1st Qu.:-0.3163 1st Qu.:-0.8141 1st Qu.:-0.405205
#> Median :-0.5098 Median : 0.0250 Median :-0.1471 Median :-0.222479
#> Mean :-0.3967 Mean : 0.2474 Mean :-0.1510 Mean :-0.246058
#> 3rd Qu.: 0.4925 3rd Qu.: 0.6905 3rd Qu.: 0.3529 3rd Qu.:-0.009658
#> Max. : 2.1761 Max. : 2.5878 Max. : 1.8377 Max. : 0.563272
#> US60 US90 US210 US390
#> Min. :-2.85438 Min. :-0.9036 Min. :-0.50038 Min. :-0.89875
#> 1st Qu.:-0.43892 1st Qu.:-0.4123 1st Qu.:-0.10579 1st Qu.:-0.09241
#> Median :-0.15123 Median : 0.1225 Median :-0.01508 Median : 0.04142
#> Mean :-0.18276 Mean : 0.1603 Mean : 0.06557 Mean : 0.11943
#> 3rd Qu.: 0.06281 3rd Qu.: 0.6199 3rd Qu.: 0.18144 3rd Qu.: 0.18669
#> Max. : 1.00712 Max. : 2.2225 Max. : 1.12214 Max. : 1.67398
#> US60 US90 US210 US390
#> Min. :-1.3800 Min. :-2.94444 Min. :-1.01720 Min. :-1.32176
#> 1st Qu.:-0.3687 1st Qu.:-0.18634 1st Qu.:-0.11358 1st Qu.:-0.35558
#> Median :-0.1100 Median : 0.05601 Median : 0.04743 Median :-0.09259
#> Mean : 0.1080 Mean : 0.02899 Mean : 0.07287 Mean :-0.01982
#> 3rd Qu.: 0.6869 3rd Qu.: 0.48146 3rd Qu.: 0.27237 3rd Qu.: 0.29955
#> Max. : 1.7346 Max. : 1.09182 Max. : 0.97792 Max. : 0.84730
#> US60 US90 US210 US390
#> Min. :-1.7918 Min. :-3.20791 Min. :-0.5665 Min. :-0.40829
#> 1st Qu.:-0.5119 1st Qu.:-0.41715 1st Qu.:-0.0899 1st Qu.:-0.04835
#> Median :-0.1389 Median : 0.18232 Median : 0.1129 Median : 0.18232
#> Mean :-0.0530 Mean : 0.07067 Mean : 0.2025 Mean : 0.22579
#> 3rd Qu.: 0.5018 3rd Qu.: 0.66872 3rd Qu.: 0.6079 3rd Qu.: 0.35914
#> Max. : 1.9545 Max. : 2.11718 Max. : 0.9111 Max. : 1.12481
#> US60 US90 US210 US390
#> Min. :-2.5257 Min. :-2.3695 Min. :-2.2557 Min. :-1.63142
#> 1st Qu.:-1.6127 1st Qu.:-0.2866 1st Qu.:-0.2105 1st Qu.:-0.20828
#> Median :-0.3778 Median : 0.6600 Median : 0.1241 Median :-0.09562
#> Mean :-0.5575 Mean : 0.3237 Mean : 0.2928 Mean :-0.02706
#> 3rd Qu.: 0.2975 3rd Qu.: 0.8961 3rd Qu.: 0.6911 3rd Qu.: 0.23099
#> Max. : 2.3763 Max. : 2.4655 Max. : 2.1848 Max. : 0.78412
#> US60 US90 US210 US390
#> Min. :-2.7932 Min. :-2.492454 Min. :-2.61740 Min. :-1.67813
#> 1st Qu.:-0.9423 1st Qu.:-0.201708 1st Qu.:-0.26291 1st Qu.:-0.43358
#> Median :-0.3059 Median :-0.009419 Median : 0.06493 Median : 0.00995
#> Mean :-0.3262 Mean : 0.265084 Mean :-0.02941 Mean :-0.03069
#> 3rd Qu.: 0.1071 3rd Qu.: 0.620449 3rd Qu.: 0.28656 3rd Qu.: 0.21746
#> Max. : 2.2920 Max. : 5.318566 Max. : 1.28785 Max. : 2.83321
#> US60 US90 US210 US390
#> Min. :-2.9444 Min. :-0.9721 Min. :-1.5506 Min. :-1.682560
#> 1st Qu.:-1.1363 1st Qu.:-0.3163 1st Qu.:-0.8141 1st Qu.:-0.405205
#> Median :-0.5098 Median : 0.0250 Median :-0.1471 Median :-0.222479
#> Mean :-0.3967 Mean : 0.2474 Mean :-0.1510 Mean :-0.246058
#> 3rd Qu.: 0.4925 3rd Qu.: 0.6905 3rd Qu.: 0.3529 3rd Qu.:-0.009658
#> Max. : 2.1761 Max. : 2.5878 Max. : 1.8377 Max. : 0.563272
#> US60 US90 US210 US390
#> Min. :-2.85438 Min. :-0.9036 Min. :-0.50038 Min. :-0.89875
#> 1st Qu.:-0.43892 1st Qu.:-0.4123 1st Qu.:-0.10579 1st Qu.:-0.09241
#> Median :-0.15123 Median : 0.1225 Median :-0.01508 Median : 0.04142
#> Mean :-0.18276 Mean : 0.1603 Mean : 0.06557 Mean : 0.11943
#> 3rd Qu.: 0.06281 3rd Qu.: 0.6199 3rd Qu.: 0.18144 3rd Qu.: 0.18669
#> Max. : 1.00712 Max. : 2.2225 Max. : 1.12214 Max. : 1.67398
#> US60 US90 US210 US390
#> Min. :-1.3800 Min. :-2.94444 Min. :-1.01720 Min. :-1.32176
#> 1st Qu.:-0.3687 1st Qu.:-0.18634 1st Qu.:-0.11358 1st Qu.:-0.35558
#> Median :-0.1100 Median : 0.05601 Median : 0.04743 Median :-0.09259
#> Mean : 0.1080 Mean : 0.02899 Mean : 0.07287 Mean :-0.01982
#> 3rd Qu.: 0.6869 3rd Qu.: 0.48146 3rd Qu.: 0.27237 3rd Qu.: 0.29955
#> Max. : 1.7346 Max. : 1.09182 Max. : 0.97792 Max. : 0.84730
#> US60 US90 US210 US390
#> Min. :-1.7918 Min. :-3.20791 Min. :-0.5665 Min. :-0.40829
#> 1st Qu.:-0.5119 1st Qu.:-0.41715 1st Qu.:-0.0899 1st Qu.:-0.04835
#> Median :-0.1389 Median : 0.18232 Median : 0.1129 Median : 0.18232
#> Mean :-0.0530 Mean : 0.07067 Mean : 0.2025 Mean : 0.22579
#> 3rd Qu.: 0.5018 3rd Qu.: 0.66872 3rd Qu.: 0.6079 3rd Qu.: 0.35914
#> Max. : 1.9545 Max. : 2.11718 Max. : 0.9111 Max. : 1.12481
 #> Warning: cannot compute exact p-value with ties
#> Warning: cannot compute exact p-value with ties
#> Warning: cannot compute exact p-value with ties
#> Warning: cannot compute exact p-value with ties
#> Warning: cannot compute exact p-value with ties
#> Warning: cannot compute exact p-value with ties
#> Warning: cannot compute exact p-value with ties
#> Warning: cannot compute exact p-value with ties
#> Warning: cannot compute exact p-value with ties
#> US60 US90 US210 US390
#> Min. :-2.08980 Min. :-0.31237 Min. :0.1792 Min. :-0.1907
#> 1st Qu.:-1.97764 1st Qu.:-0.19129 1st Qu.:0.5294 1st Qu.: 0.2341
#> Median :-0.47593 Median : 0.04929 Median :0.7023 Median : 0.3501
#> Mean :-0.81483 Mean : 0.25813 Mean :0.9934 Mean : 0.6023
#> 3rd Qu.:-0.09126 3rd Qu.: 0.54588 3rd Qu.:1.6357 3rd Qu.: 0.9610
#> Max. : 0.68123 Max. : 1.53985 Max. :2.1467 Max. : 1.5644
#> US60 US90 US210 US390
#> Min. :-2.6684 Min. :-0.26913 Min. :0.06714 Min. :-0.8210
#> 1st Qu.:-0.8209 1st Qu.:-0.01513 1st Qu.:0.33706 1st Qu.: 0.1477
#> Median :-0.6285 Median : 0.43284 Median :0.57086 Median : 0.3322
#> Mean :-0.8521 Mean : 0.59842 Mean :1.02346 Mean : 0.2843
#> 3rd Qu.:-0.5024 3rd Qu.: 0.81355 3rd Qu.:1.95153 3rd Qu.: 0.5248
#> Max. :-0.2160 Max. : 2.52972 Max. :2.46712 Max. : 1.0576
#> US60 US90 US210 US390
#> Min. :-1.7362 Min. :-0.37531 Min. :0.4137 Min. :-0.39973
#> 1st Qu.:-1.2935 1st Qu.:-0.05243 1st Qu.:0.6403 1st Qu.: 0.01476
#> Median :-0.6122 Median : 0.15453 Median :0.9058 Median : 0.39314
#> Mean :-0.6003 Mean : 0.42682 Mean :1.4471 Mean : 0.60801
#> 3rd Qu.:-0.1362 3rd Qu.: 0.39540 3rd Qu.:1.7758 3rd Qu.: 1.02303
#> Max. : 1.0030 Max. : 2.61726 Max. :4.0489 Max. : 1.98138
#> US60 US90 US210 US390
#> Min. :-0.8031 Min. :-0.37068 Min. :-0.004577 Min. :-0.3330
#> 1st Qu.:-0.3147 1st Qu.:-0.03856 1st Qu.: 0.380320 1st Qu.: 0.1424
#> Median :-0.2022 Median : 0.16561 Median : 0.695225 Median : 0.1763
#> Mean :-0.1834 Mean : 0.31788 Mean : 0.845885 Mean : 0.2404
#> 3rd Qu.:-0.1566 3rd Qu.: 0.39576 3rd Qu.: 1.079119 3rd Qu.: 0.2242
#> Max. : 0.7312 Max. : 1.85850 Max. : 2.131919 Max. : 1.1892
#> US60 US90 US210 US390
#> Min. :-1.44692 Min. :-0.2031 Min. :-0.2513 Min. :-0.22907
#> 1st Qu.:-0.58974 1st Qu.: 0.1317 1st Qu.: 0.3010 1st Qu.: 0.01654
#> Median :-0.30087 Median : 0.1696 Median : 0.4453 Median : 0.23275
#> Mean :-0.37780 Mean : 0.3969 Mean : 0.7177 Mean : 0.31001
#> 3rd Qu.:-0.09775 3rd Qu.: 0.5669 3rd Qu.: 1.0310 3rd Qu.: 0.61957
#> Max. : 0.35066 Max. : 1.4722 Max. : 2.4299 Max. : 1.02008
#> US60 US90 US210 US390
#> Min. :-1.09861 Min. :-0.11204 Min. :0.3050 Min. :-0.09353
#> 1st Qu.:-0.54020 1st Qu.: 0.04746 1st Qu.:0.5177 1st Qu.: 0.22531
#> Median :-0.11493 Median : 0.11738 Median :0.6666 Median : 0.51500
#> Mean :-0.22662 Mean : 0.33689 Mean :1.0728 Mean : 0.74727
#> 3rd Qu.: 0.03167 3rd Qu.: 0.21122 3rd Qu.:1.5670 3rd Qu.: 0.91661
#> Max. : 0.75524 Max. : 2.05415 Max. :2.5510 Max. : 2.28725
#> Warning: cannot compute exact p-value with ties
#> Warning: cannot compute exact p-value with ties
#> Warning: cannot compute exact p-value with ties
#> Warning: cannot compute exact p-value with ties
#> Warning: cannot compute exact p-value with ties
#> Warning: cannot compute exact p-value with ties
#> Warning: cannot compute exact p-value with ties
#> Warning: cannot compute exact p-value with ties
#> Warning: cannot compute exact p-value with ties
#> Warning: cannot compute exact p-value with ties
#> US60 US90 US210 US390
#> Min. :-2.08980 Min. :-0.31237 Min. :0.1792 Min. :-0.1907
#> 1st Qu.:-1.97764 1st Qu.:-0.19129 1st Qu.:0.5294 1st Qu.: 0.2341
#> Median :-0.47593 Median : 0.04929 Median :0.7023 Median : 0.3501
#> Mean :-0.81483 Mean : 0.25813 Mean :0.9934 Mean : 0.6023
#> 3rd Qu.:-0.09126 3rd Qu.: 0.54588 3rd Qu.:1.6357 3rd Qu.: 0.9610
#> Max. : 0.68123 Max. : 1.53985 Max. :2.1467 Max. : 1.5644
#> US60 US90 US210 US390
#> Min. :-2.6684 Min. :-0.26913 Min. :0.06714 Min. :-0.8210
#> 1st Qu.:-0.8209 1st Qu.:-0.01513 1st Qu.:0.33706 1st Qu.: 0.1477
#> Median :-0.6285 Median : 0.43284 Median :0.57086 Median : 0.3322
#> Mean :-0.8521 Mean : 0.59842 Mean :1.02346 Mean : 0.2843
#> 3rd Qu.:-0.5024 3rd Qu.: 0.81355 3rd Qu.:1.95153 3rd Qu.: 0.5248
#> Max. :-0.2160 Max. : 2.52972 Max. :2.46712 Max. : 1.0576
#> US60 US90 US210 US390
#> Min. :-1.7362 Min. :-0.37531 Min. :0.4137 Min. :-0.39973
#> 1st Qu.:-1.2935 1st Qu.:-0.05243 1st Qu.:0.6403 1st Qu.: 0.01476
#> Median :-0.6122 Median : 0.15453 Median :0.9058 Median : 0.39314
#> Mean :-0.6003 Mean : 0.42682 Mean :1.4471 Mean : 0.60801
#> 3rd Qu.:-0.1362 3rd Qu.: 0.39540 3rd Qu.:1.7758 3rd Qu.: 1.02303
#> Max. : 1.0030 Max. : 2.61726 Max. :4.0489 Max. : 1.98138
#> US60 US90 US210 US390
#> Min. :-0.8031 Min. :-0.37068 Min. :-0.004577 Min. :-0.3330
#> 1st Qu.:-0.3147 1st Qu.:-0.03856 1st Qu.: 0.380320 1st Qu.: 0.1424
#> Median :-0.2022 Median : 0.16561 Median : 0.695225 Median : 0.1763
#> Mean :-0.1834 Mean : 0.31788 Mean : 0.845885 Mean : 0.2404
#> 3rd Qu.:-0.1566 3rd Qu.: 0.39576 3rd Qu.: 1.079119 3rd Qu.: 0.2242
#> Max. : 0.7312 Max. : 1.85850 Max. : 2.131919 Max. : 1.1892
#> US60 US90 US210 US390
#> Min. :-1.44692 Min. :-0.2031 Min. :-0.2513 Min. :-0.22907
#> 1st Qu.:-0.58974 1st Qu.: 0.1317 1st Qu.: 0.3010 1st Qu.: 0.01654
#> Median :-0.30087 Median : 0.1696 Median : 0.4453 Median : 0.23275
#> Mean :-0.37780 Mean : 0.3969 Mean : 0.7177 Mean : 0.31001
#> 3rd Qu.:-0.09775 3rd Qu.: 0.5669 3rd Qu.: 1.0310 3rd Qu.: 0.61957
#> Max. : 0.35066 Max. : 1.4722 Max. : 2.4299 Max. : 1.02008
#> US60 US90 US210 US390
#> Min. :-1.09861 Min. :-0.11204 Min. :0.3050 Min. :-0.09353
#> 1st Qu.:-0.54020 1st Qu.: 0.04746 1st Qu.:0.5177 1st Qu.: 0.22531
#> Median :-0.11493 Median : 0.11738 Median :0.6666 Median : 0.51500
#> Mean :-0.22662 Mean : 0.33689 Mean :1.0728 Mean : 0.74727
#> 3rd Qu.: 0.03167 3rd Qu.: 0.21122 3rd Qu.:1.5670 3rd Qu.: 0.91661
#> Max. : 0.75524 Max. : 2.05415 Max. :2.5510 Max. : 2.28725
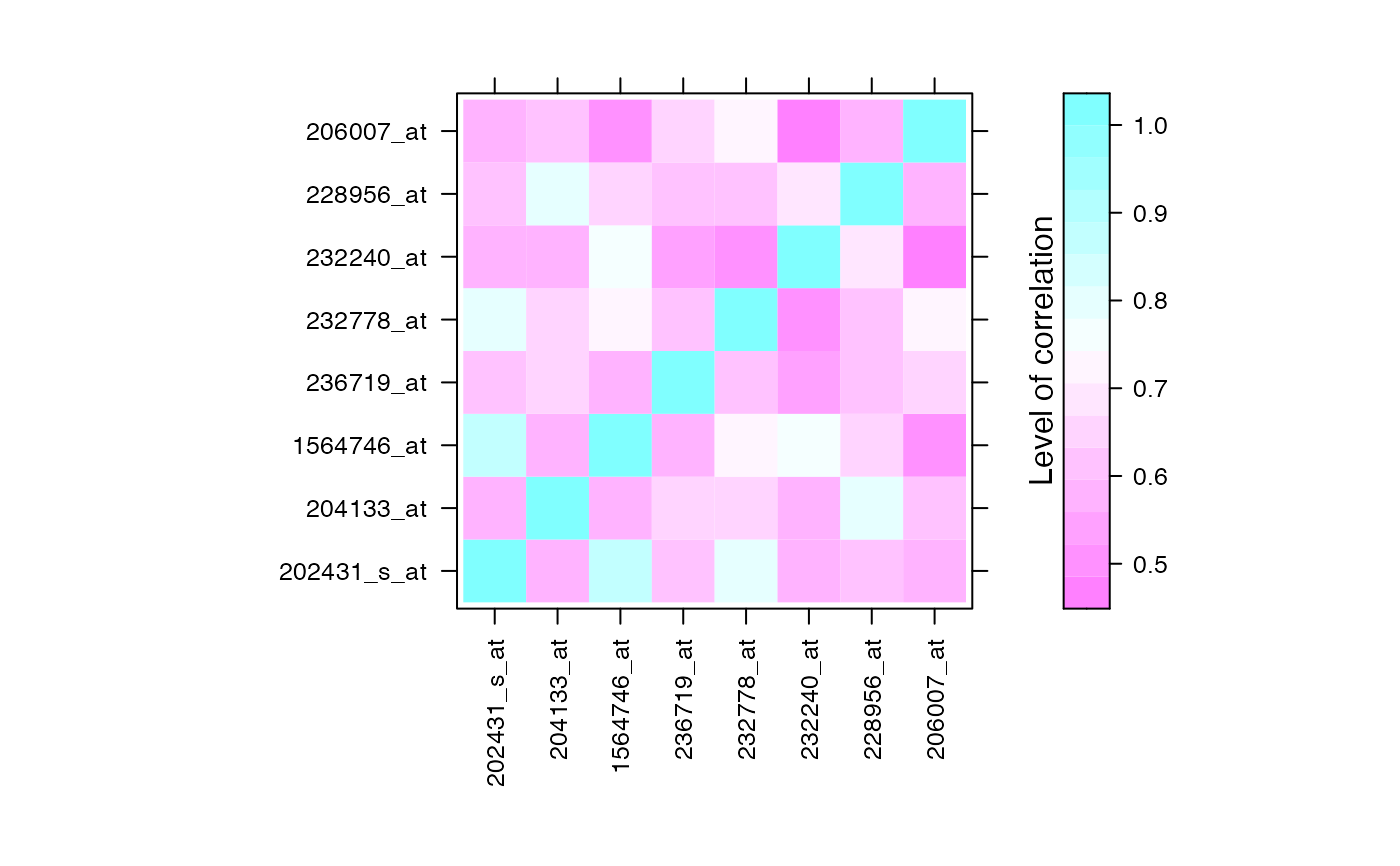 if(require(CascadeData)){
data(micro_US)
micro_US<-as.micro_array(micro_US,time=c(60,90,210,390),subject=6)
data(micro_S)
micro_S<-as.micro_array(micro_S,time=c(60,90,210,390),subject=6)
#Genes with differential expression at t1
Selection1<-geneSelection(x=micro_S,y=micro_US,20,wanted.patterns= rbind(c(1,0,0,0)))
#Genes with differential expression at t2
Selection2<-geneSelection(x=micro_S,y=micro_US,20,wanted.patterns= rbind(c(0,1,0,0)))
#Genes with differential expression at t3
Selection3<-geneSelection(x=micro_S,y=micro_US,20,wanted.patterns= rbind(c(0,0,1,0)))
#Genes with differential expression at t4
Selection4<-geneSelection(x=micro_S,y=micro_US,20,wanted.patterns= rbind(c(0,0,0,1)))
#Genes with global differential expression
Selection5<-geneSelection(x=micro_S,y=micro_US,20)
#We then merge these selections:
Selection<-unionMicro(list(Selection1,Selection2,Selection3,Selection4,Selection5))
print(Selection)
#Prints the correlation graphics Figure 4:
summary(Selection,3)
##Uncomment this code to retrieve geneids.
#library(org.Hs.eg.db)
#
#ff<-function(x){substr(x, 1, nchar(x)-3)}
#ff<-Vectorize(ff)
#
##Here is the function to transform the probeset names to gene ID.
#
#library("hgu133plus2.db")
#
#probe_to_id<-function(n){
#x <- hgu133plus2SYMBOL
#mp<-mappedkeys(x)
#xx <- unlist(as.list(x[mp]))
#genes_all = xx[(n)]
#genes_all[is.na(genes_all)]<-"unknown"
#return(genes_all)
#}
#Selection@name<-probe_to_id(Selection@name)
}
#> Error in dimnames(x) <- dn: 'dimnames' applied to non-array
# }
