Experimental Data of Cascade Experiments in Genomics
Frédéric Bertrand and Myriam Maumy-Bertrand
https://doi.org/10.32614/CRAN.package.CascadeData
The goal of CascadeData is to provide the experimental data GSE39411 in a ready to use format. Vallat L, Kemper CA, Jung N, Maumy-Bertrand M, Bertrand F, …, Bahram S, (2013), “Reverse-engineering the genetic circuitry of a cancer cell with predicted intervention in chronic lymphocytic leukemia”. Proc Natl Acad Sci USA, 110(2):459-64, https://dx.doi.org/10.1073/pnas.1211130110.
These are featured as examples by packages such as the Cascade one, a modeling tool allowing gene selection, reverse engineering, and prediction in cascade networks. (Jung, N., Bertrand, F., Bahram, S., Vallat, L., and Maumy-Bertrand, M., 2014, https://dx.doi.org/10.1093/bioinformatics/btt705).
This website and these examples were created by F. Bertrand and M. Maumy-Bertrand.
Installation
You can install the released version of CascadeData from CRAN with:
install.packages("CascadeData")You can install the development version of CascadeData from github with:
devtools::install_github("fbertran/CascadeData")Examples
Probesets
Two data frames with 54613 probesets with repeated measurements on 6 independent subjects at 4 time points.
data(micro_S)
str(micro_S)
#> 'data.frame':    54613 obs. of  24 variables:
#>  $ N1_S_T60 : num  136.1 32 78 201.8 16.3 ...
#>  $ N1_S_T90 : num  116.6 43.3 63.5 209.2 8 ...
#>  $ N1_S_T210: num  127.6 31.3 57.9 208.8 15.8 ...
#>  $ N1_S_T390: num  126.8 43.8 73.2 228.2 15.8 ...
#>  $ N2_S_T60 : num  142.2 25.4 53.2 165.3 17.8 ...
#>  $ N2_S_T90 : num  132.5 35.4 97.1 222.3 10.7 ...
#>  $ N2_S_T210: num  122.8 33.3 66.5 175.4 12.9 ...
#>  $ N2_S_T390: num  132.1 55.7 69.7 178.5 13.9 ...
#>  $ N3_S_T60 : num  134 60 52.1 214.6 6.6 ...
#>  $ N3_S_T90 : num  157.1 48.7 59.9 279.5 3.7 ...
#>  $ N3_S_T210: num  49.1 45.7 44.1 181.2 1.3 ...
#>  $ N3_S_T390: num  139.8 41.4 51.8 264.9 19.5 ...
#>  $ N4_S_T60 : num  157.4 66.8 74 214.1 26.1 ...
#>  $ N4_S_T90 : num  158.3 44.8 56.8 222.7 17.9 ...
#>  $ N4_S_T210: num  145.9 42.5 59.8 221.8 18.5 ...
#>  $ N4_S_T390: num  171.2 59.2 62.3 193.3 25.1 ...
#>  $ N5_S_T60 : num  130.1 60.8 63.8 208.5 18.6 ...
#>  $ N5_S_T90 : num  119.7 41.8 47.2 222.8 26.9 ...
#>  $ N5_S_T210: num  121.3 40.5 62.7 226 21.5 ...
#>  $ N5_S_T390: num  110 44 63 227.8 27.2 ...
#>  $ N6_S_T60 : num  114.5 60.7 79.5 219.4 22.1 ...
#>  $ N6_S_T90 : num  144 38.9 79.4 234.8 28.4 ...
#>  $ N6_S_T210: num  128.4 38.7 63.4 241.9 30.5 ...
#>  $ N6_S_T390: num  132.7 52.3 66.6 218.7 19.2 ...
data(micro_US)
str(micro_US)
#> 'data.frame':    54613 obs. of  24 variables:
#>  $ N1_US_T60 : num  103.2 26 70.7 213.7 13.7 ...
#>  $ N1_US_T90 : num  133.7 34.9 71.2 168.9 17.2 ...
#>  $ N1_US_T210: num  157.3 44.2 59.4 175.1 27.8 ...
#>  $ N1_US_T390: num  179.4 44.1 62.7 225.1 10.5 ...
#>  $ N2_US_T60 : num  120.7 47.4 85.8 156.7 16.7 ...
#>  $ N2_US_T90 : num  150.5 40.4 74.4 200.4 25.8 ...
#>  $ N2_US_T210: num  153.5 51.8 71.7 181.6 23 ...
#>  $ N2_US_T390: num  174.8 61.6 66.8 224.5 12.2 ...
#>  $ N3_US_T60 : num  145 64.5 50.8 184.5 17.5 ...
#>  $ N3_US_T90 : num  162.2 58.7 51.9 219.1 21.5 ...
#>  $ N3_US_T210: num  177.8 35.9 58.3 250 12.7 ...
#>  $ N3_US_T390: num  189.6 50.5 62.8 262 20.1 ...
#>  $ N4_US_T60 : num  136 60.9 67.8 227.1 29.6 ...
#>  $ N4_US_T90 : num  135.2 62.2 65.3 221.1 18.2 ...
#>  $ N4_US_T210: num  165.3 62.7 63.3 212.1 21.4 ...
#>  $ N4_US_T390: num  154.3 47.1 68.9 199.7 9.3 ...
#>  $ N5_US_T60 : num  130.9 57.5 56.5 199 20.5 ...
#>  $ N5_US_T90 : num  122.3 49.4 62 226.8 15.4 ...
#>  $ N5_US_T210: num  184.8 57.2 53.4 191.2 18.1 ...
#>  $ N5_US_T390: num  174.6 68 69.1 214 16.5 ...
#>  $ N6_US_T60 : num  142.8 67.9 73.3 220.1 24.7 ...
#>  $ N6_US_T90 : num  148.1 46.4 79.9 257.7 20.7 ...
#>  $ N6_US_T210: num  198.1 53.9 68.6 223.3 18.9 ...
#>  $ N6_US_T390: num  155.8 42.6 63.2 236.7 15.2 ...
Some preliminary between group comparison. First create grouping factor.
Then, create the 2 most discriminative components (probeset linear combinaison, i.e. scores) featuring 100 probesets each using sparse partial least squares discrimant analysis from the mixOmics package, doi:10.18129/B9.bioc.mixOmics. An optimal choice of the number of components and of the number of kept genes can be carried out using cross-validation.
First makes sure that the mixOmics Bioconductor package is installed.
if (!requireNamespace("limma", quietly = TRUE)){
  if (!requireNamespace("BiocManager", quietly = TRUE)){
    install.packages("BiocManager")
    }
  BiocManager::install("limma")
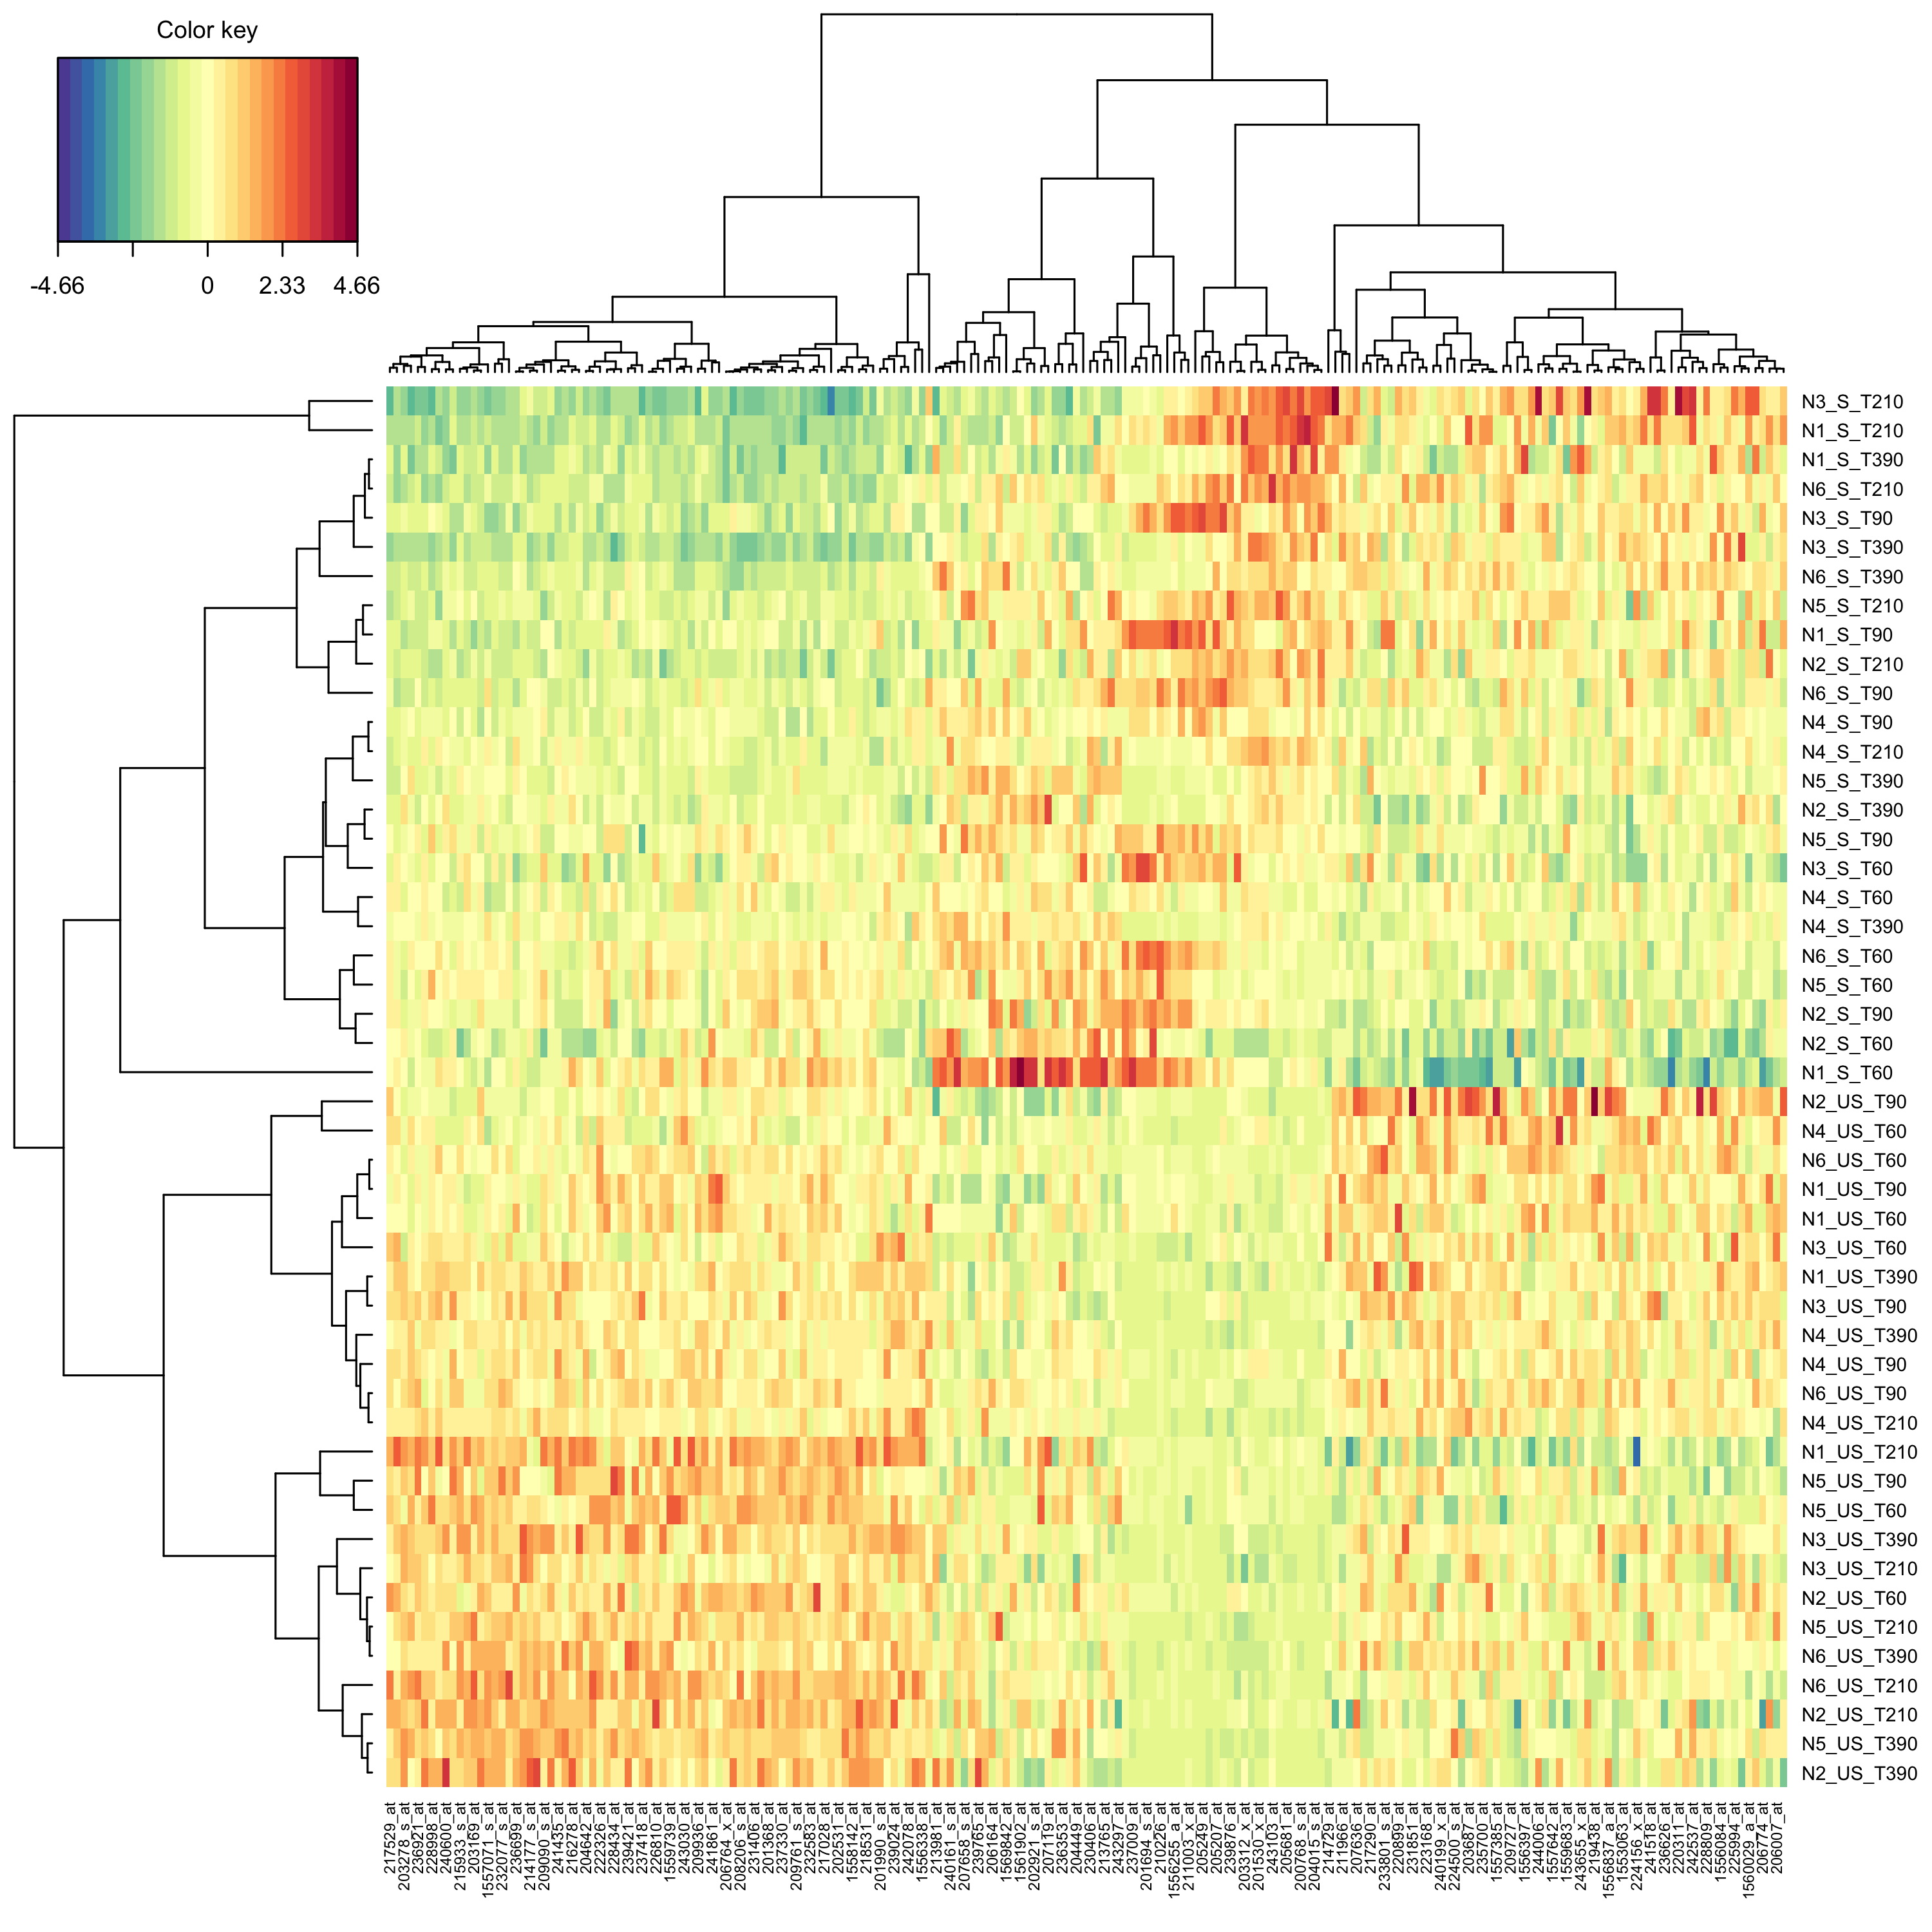
}Create a clustered image map (cim, i.e. heat map) to represent the results of the splsda analysis.
mixOmics::cim(modsplsda)
plot of chunk cim
Retrieve the names of the probesets that were selected to create the 2 splsda components
selectedprobesets<-unique(mixOmics::selectVar(modsplsda)$name,
mixOmics::selectVar(modsplsda, comp=2)$name)
First makes sure that the limma Bioconductor package is installed.
if (!requireNamespace("limma", quietly = TRUE)){
  if (!requireNamespace("BiocManager", quietly = TRUE)){
    install.packages("BiocManager")
    }
  BiocManager::install("limma")
}
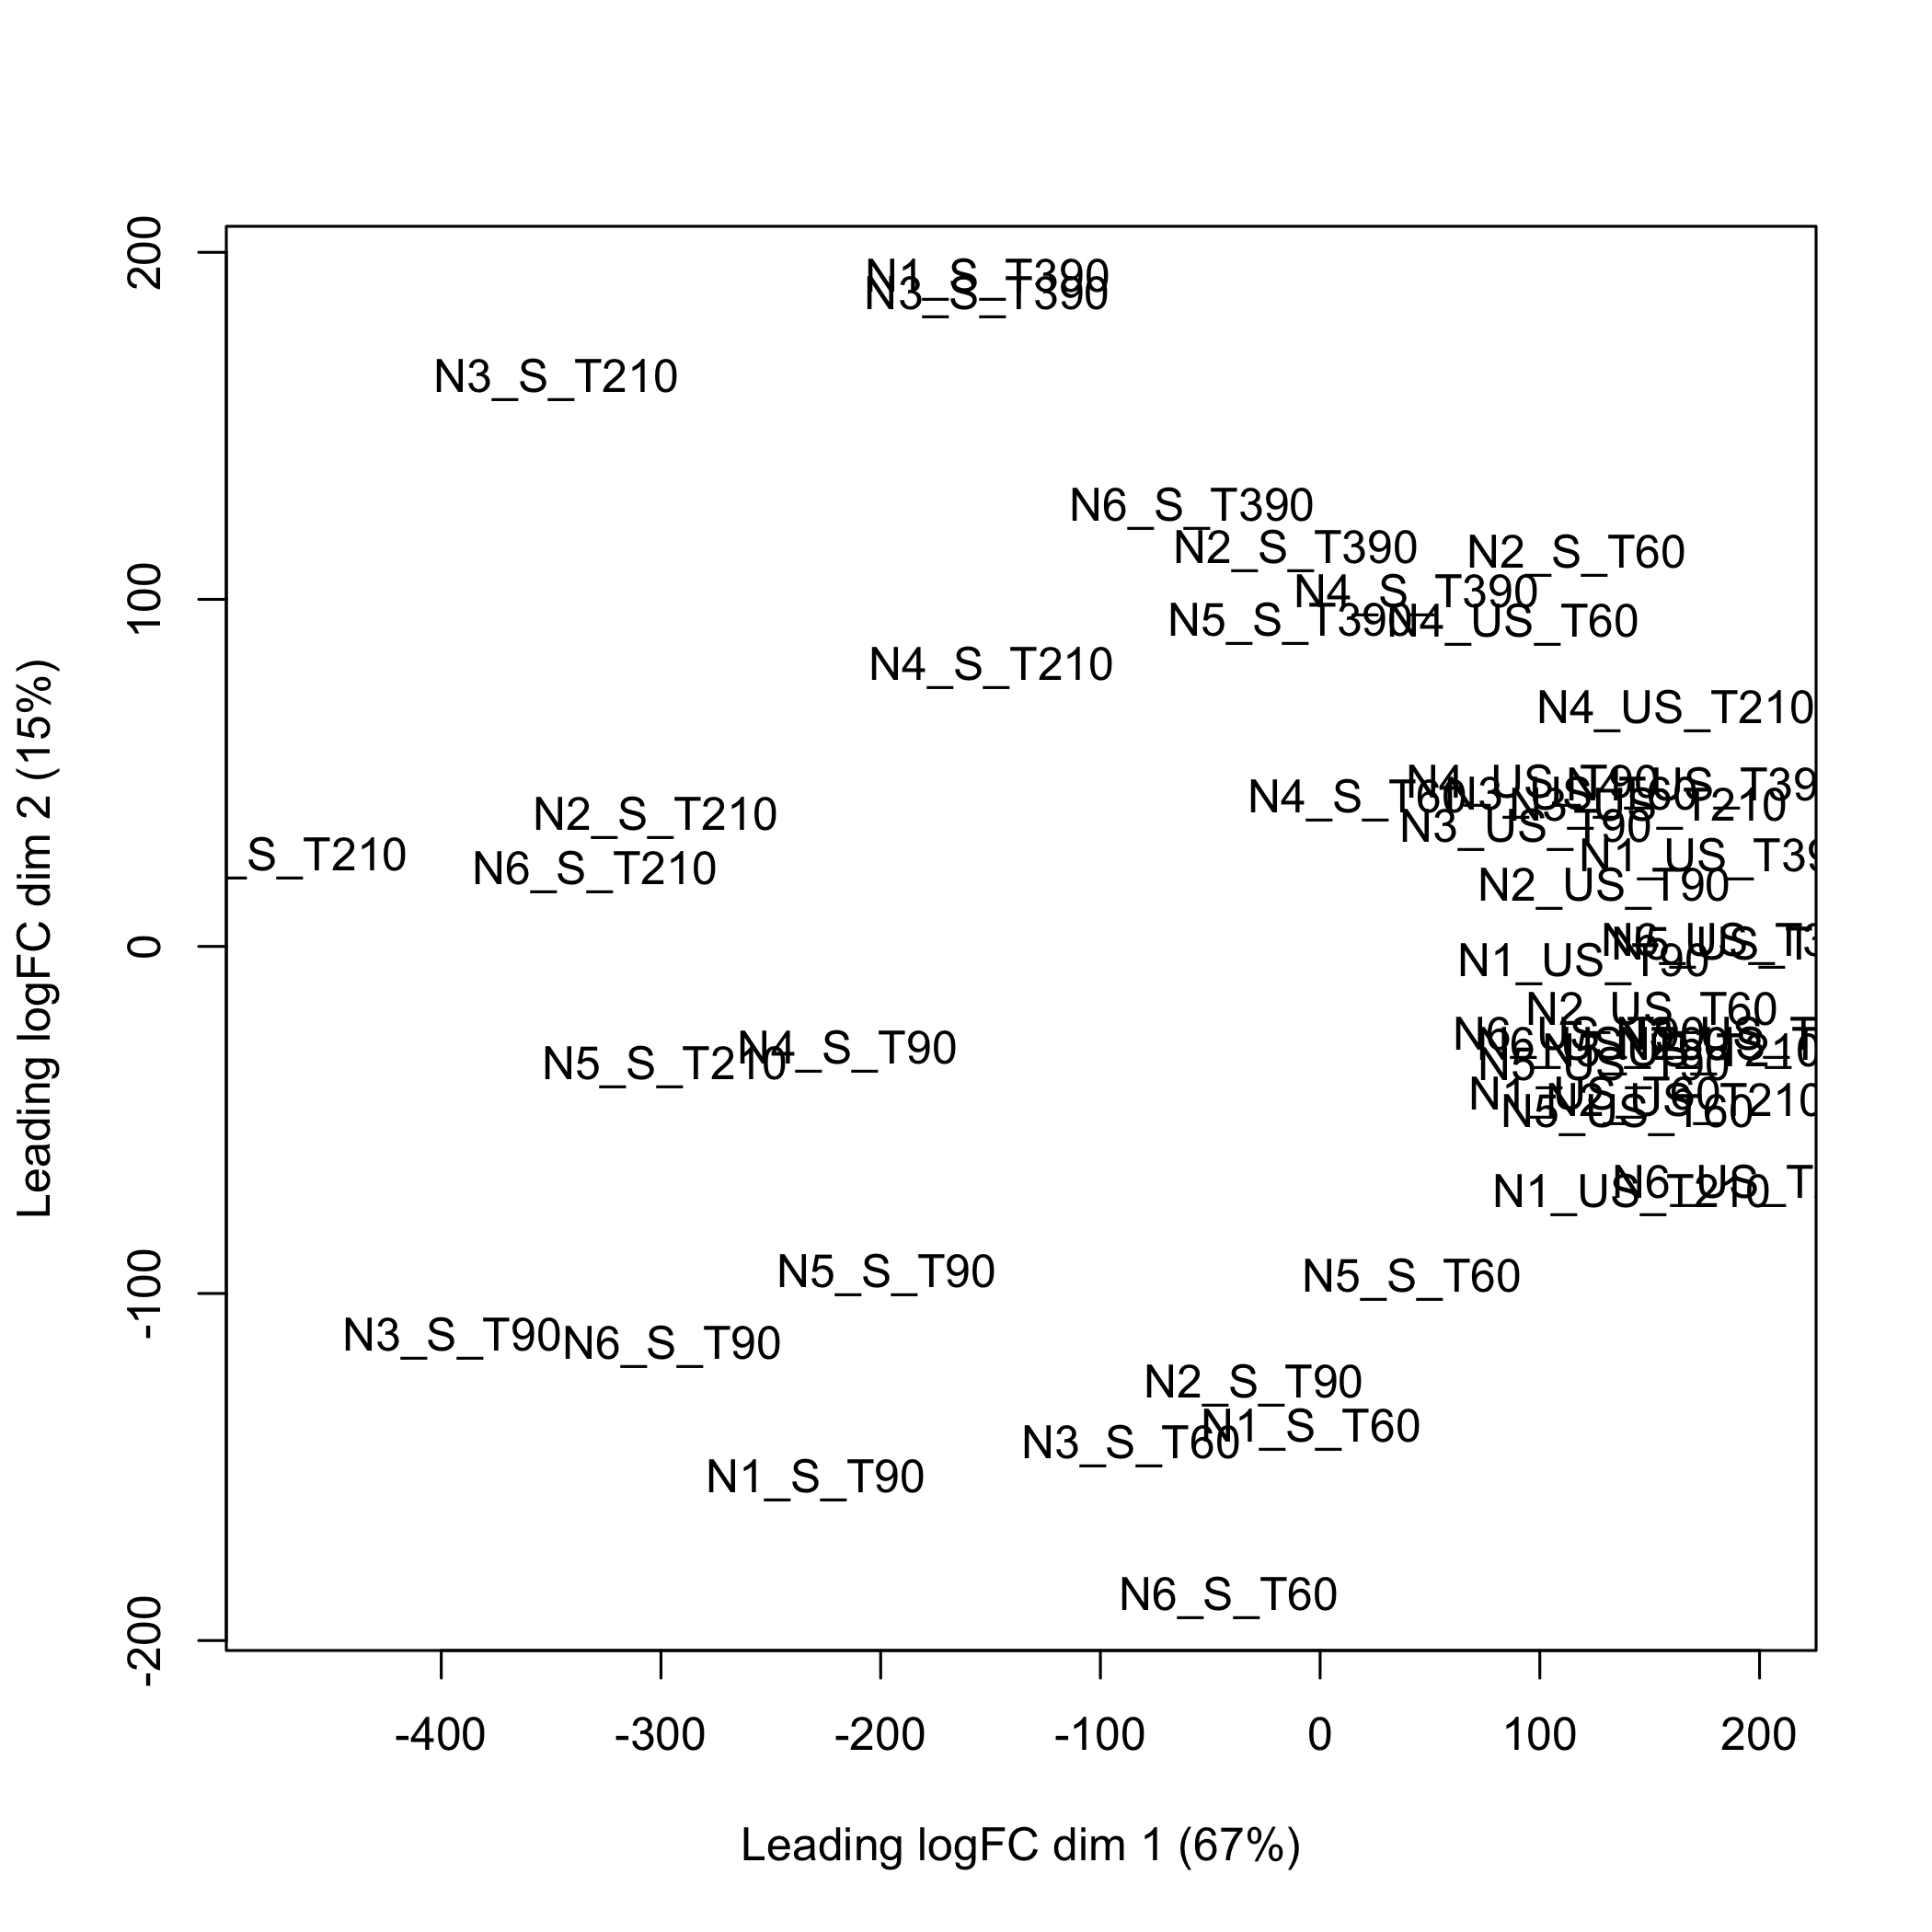
Using the limma, doi:10.18129/B9.bioc.limma, plotMDS function to create the multidimensional scaling plot of distances between the probeset expression profiles that were selected using splsda.

plot of chunk plotMDS
Entrez GeneIDs
The jetset package enables the selection of optimal probe sets from the HG-U95Av2, HG-U133A, HG-U133 Plus 2.0, or U133 X3P microarray platforms. It requires the org.Hs.eg.db Bioconductor package, doi:10.18129/B9.bioc.org.Hs.eg.db.
First makes sure that the jetset CRAN package and the org.Hs.eg.db Bioconductor package are installed.
if (!requireNamespace("org.Hs.eg.db", quietly = TRUE)){
  if (!requireNamespace("BiocManager", quietly = TRUE)){
      install.packages("BiocManager")
    }
  BiocManager::install("org.Hs.eg.db", version = "3.8")
}
#>
if (!requireNamespace("jetset", quietly = TRUE)){
  install.packages("jetset")
}
Retrieve the optimal probesets for a given Entrez GeneID.
library(jetset)
resjetset=jetset::jmap("hgu133plus2", eg = sort(unique(scores.hgu133plus2$EntrezID)))
Select the optimal probesets from the datasets for a given Entrez GeneID.
micro_S_jetset<-micro_S[resjetset,]
rownames(micro_S_jetset)<-names(resjetset)
micro_US_jetset<-micro_US[resjetset,]
rownames(micro_US_jetset)<-names(resjetset)
Then, create the 2 most discriminative components (probeset linear combinaison, i.e. scores) featuring 100 probesets each using sparse partial least squares discrimant analysis from the mixOmics package, doi:10.18129/B9.bioc.mixOmics. An optimal choice of the number of components and of the number of kept genes can be carried out using cross-validation.
First makes sure that the mixOmics Bioconductor package is installed.
modsplsda_jetset=mixOmics::splsda(t(cbind(micro_S_jetset,micro_US_jetset)),
groupf, ncomp = 2, keepX = c(100, 100))
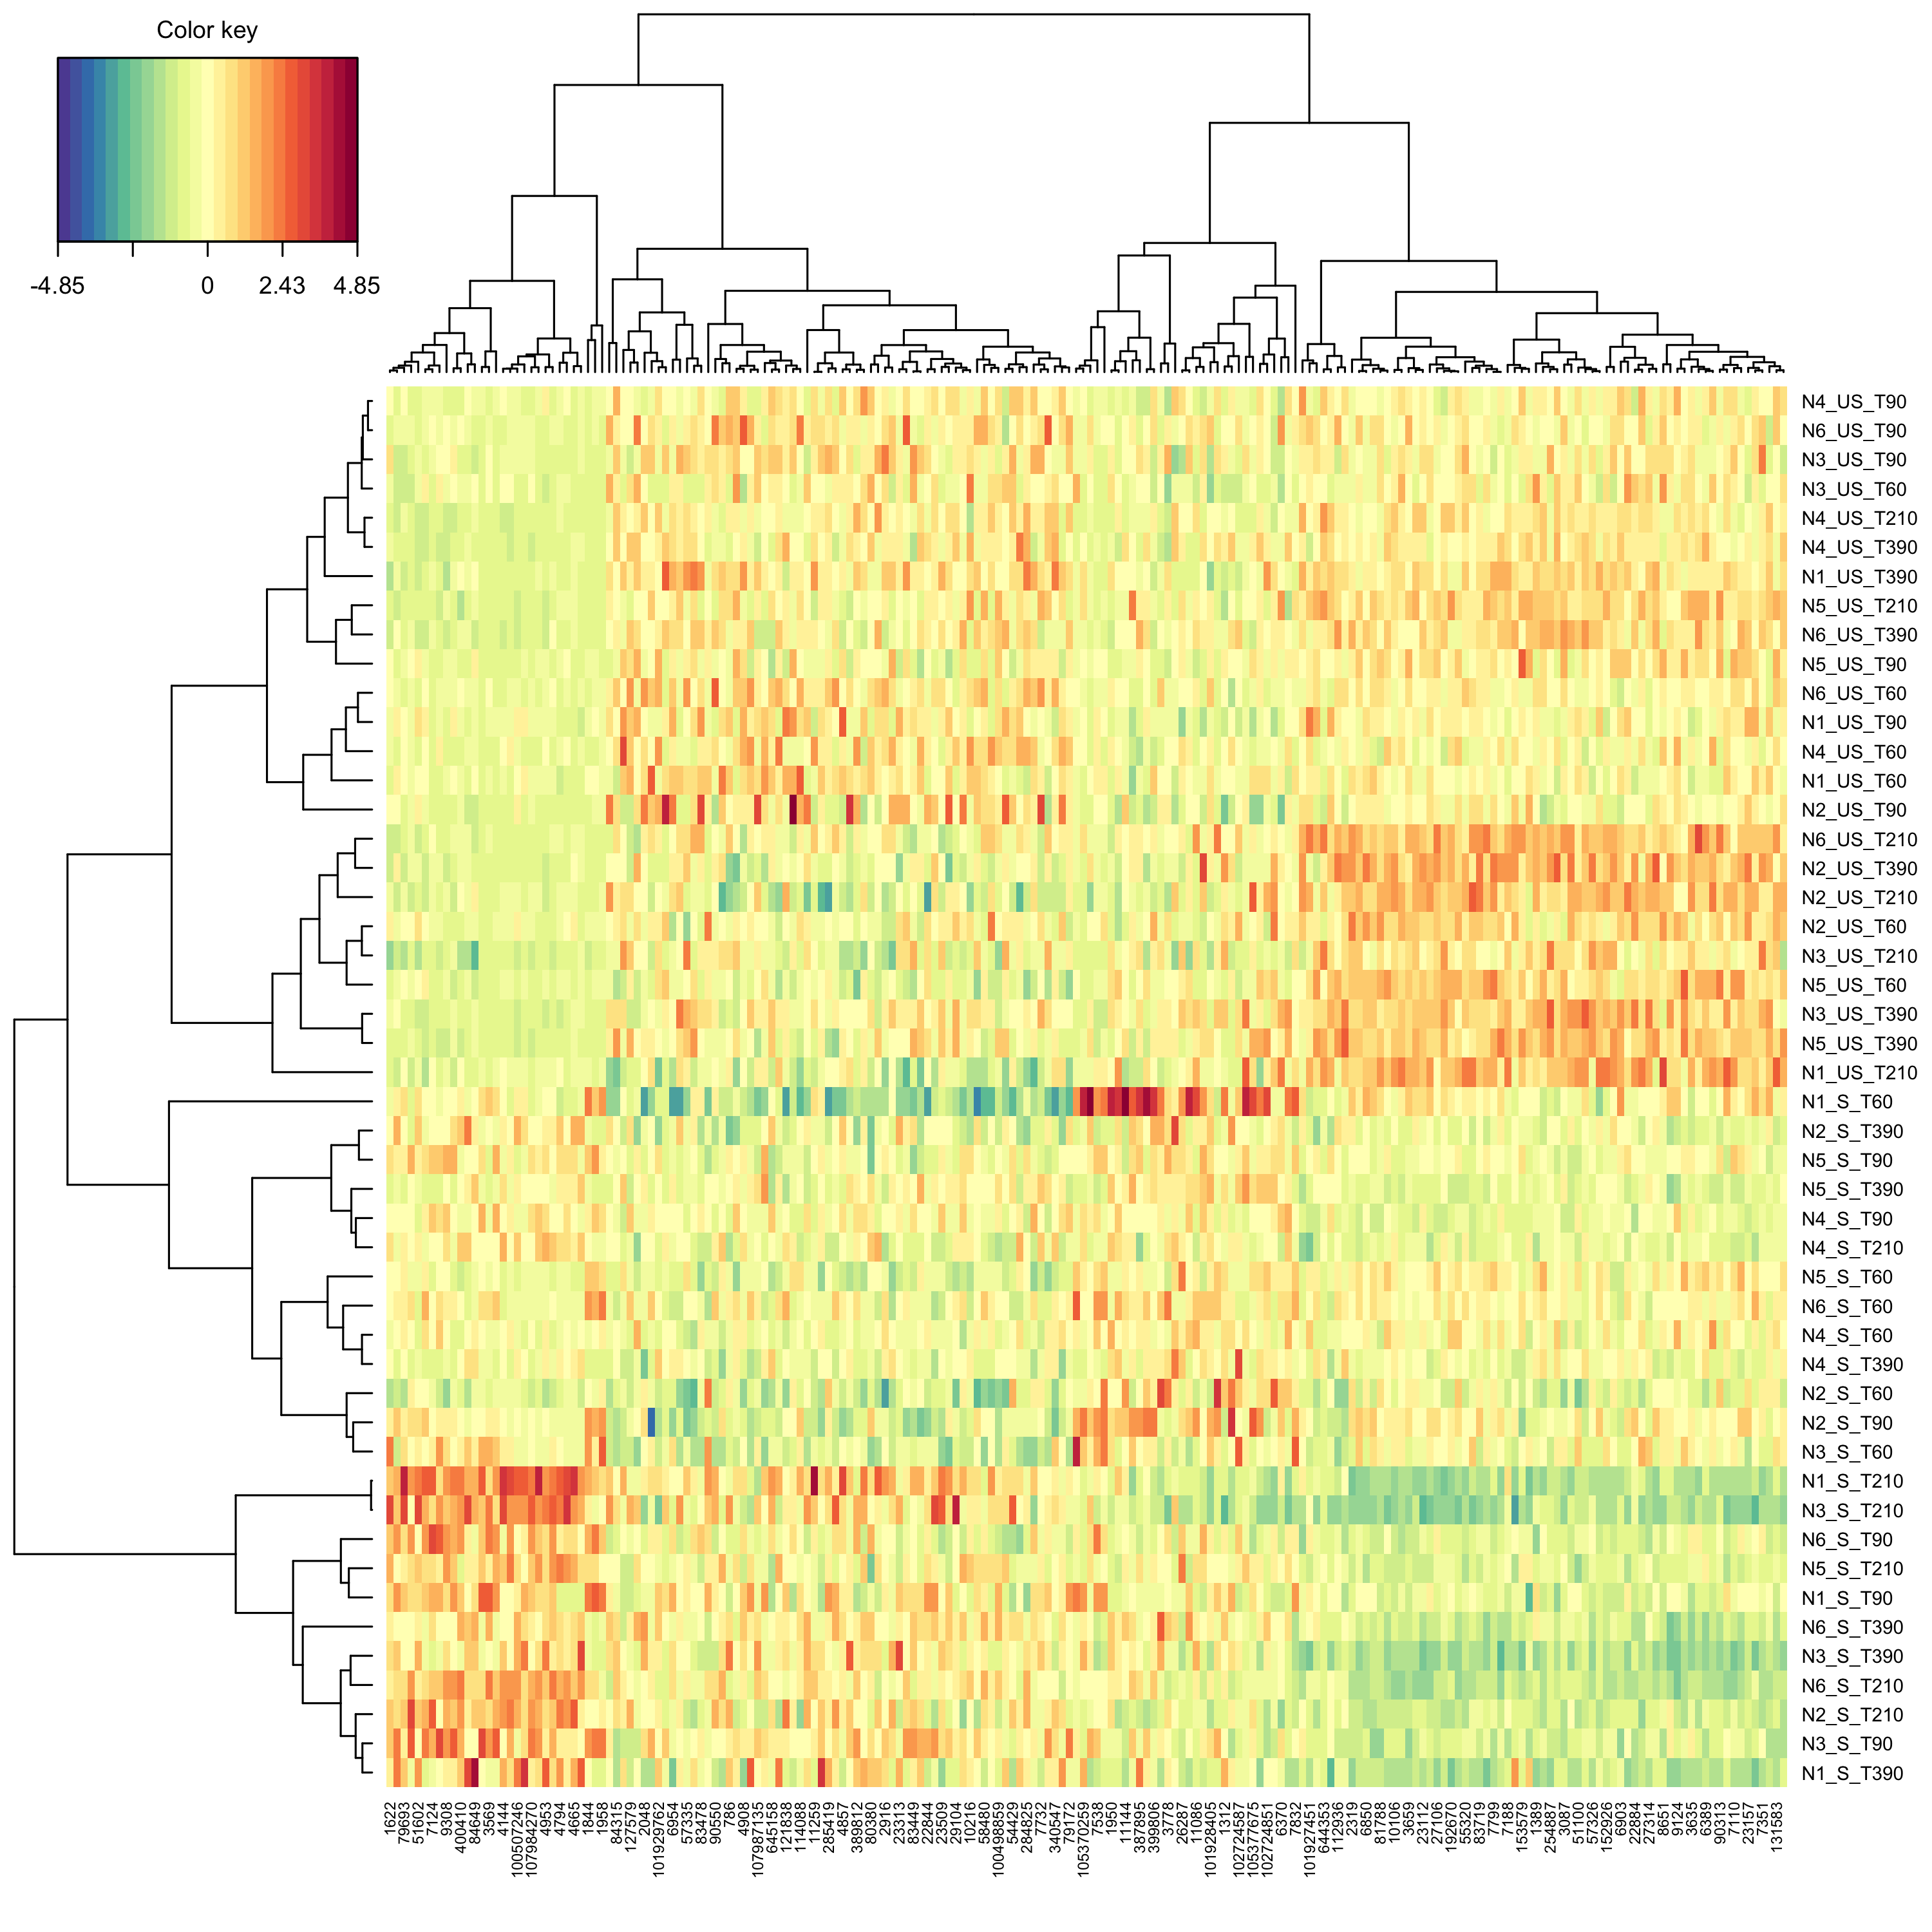
Create a clustered image map (cim, i.e. heat map) to represent the results of the splsda analysis.
mixOmics::cim(modsplsda_jetset)
plot of chunk cimjetset
Retrieve the Entrez GeneIDs that were selected to create the 2 splsda components
selectedEntrezGeneIDs<-unique(mixOmics::selectVar(modsplsda_jetset)$name,
mixOmics::selectVar(modsplsda, comp=2)$name)
First makes sure that the limma Bioconductor package is installed.
if (!requireNamespace("limma", quietly = TRUE)){
  if (!requireNamespace("BiocManager", quietly = TRUE)){
    install.packages("BiocManager")
    }
  BiocManager::install("limma")
}
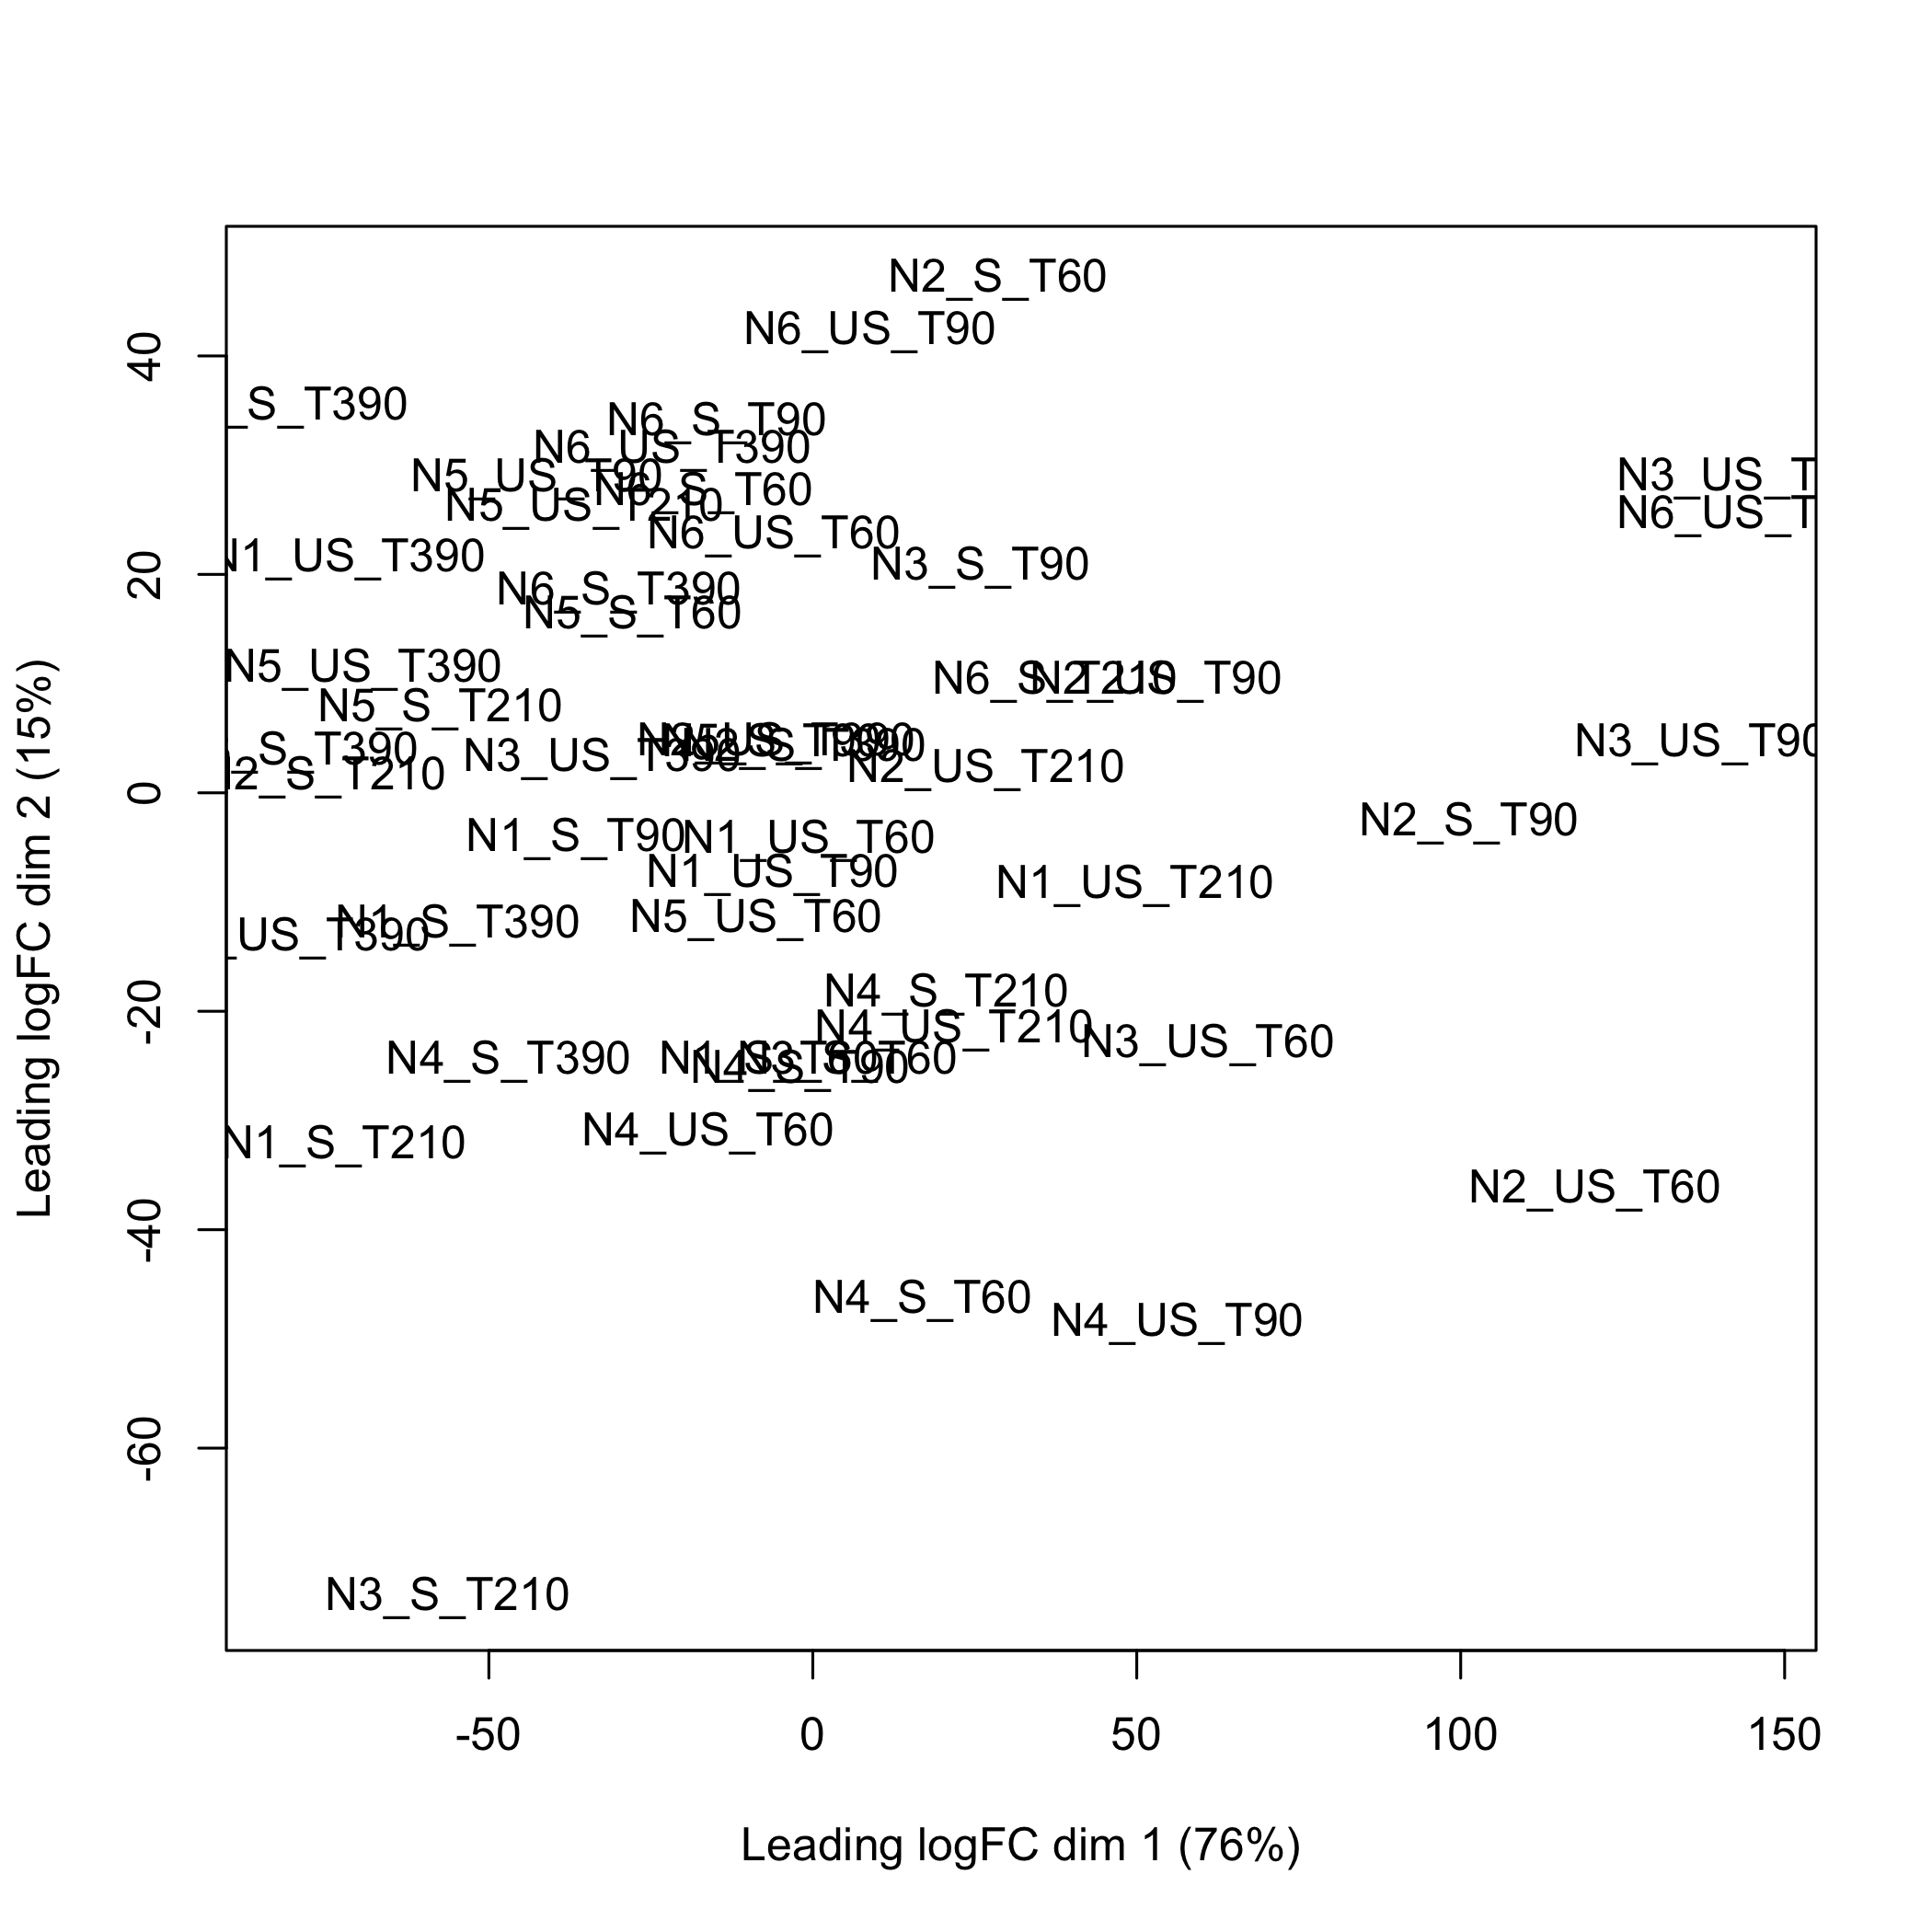
Using the limma, doi:10.18129/B9.bioc.limma, plotMDS function to create the multidimensional scaling plot of distances between the Entrez GeneID expression profiles that were selected using splsda.

plot of chunk plotMDSegid
