Plot for the hub probabilities ; there is one probability for each node in the network.
Examples
data(resabc)
showHp(resabc)
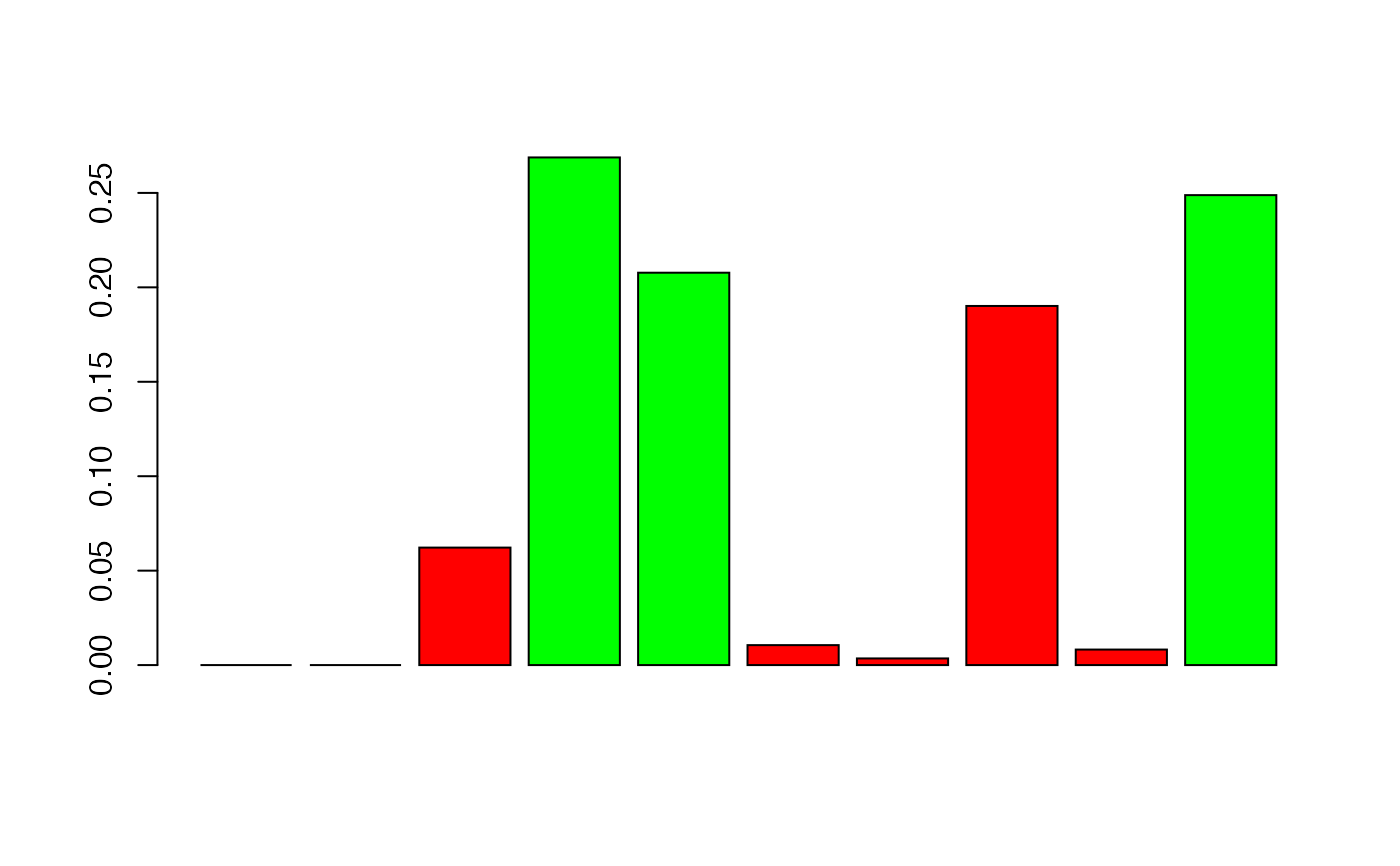 #> gene.hubs hubs.proba
#> 1 4 0.2687793
#> 2 5 0.2077465
#> 3 10 0.2488263
#> gene.hubs hubs.proba
#> 1 4 0.2687793
#> 2 5 0.2077465
#> 3 10 0.2488263
Plot for the hub probabilities ; there is one probability for each node in the network.
data(resabc)
showHp(resabc)
#> gene.hubs hubs.proba
#> 1 4 0.2687793
#> 2 5 0.2077465
#> 3 10 0.2488263