R/show.R
showNp.Rd
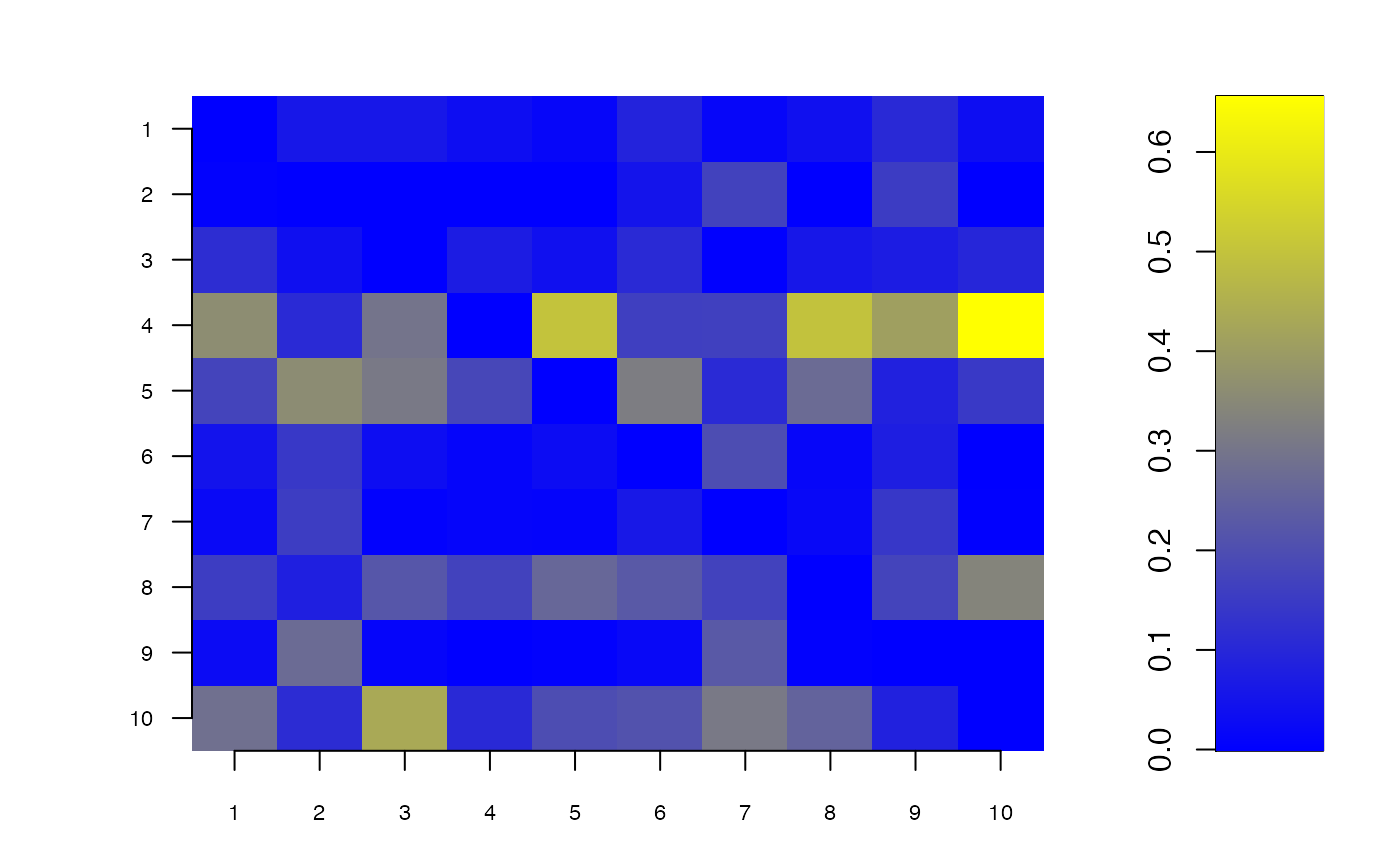
Plot for the neighbourhood probabilities ; there is one probability for each pair of node in the network.
showNp(result)
: The result of the abc algorithm.
data(resabc)
showNp(resabc)