Plot a selectboostboost object.
Usage
# S3 method for class 'selectboost'
plot(
  x,
  verbose = FALSE,
  prop.level = 0.95,
  conf.int.level = 0.95,
  conf.threshold = 0.95,
  ...
)
Arguments
- x
Numerical matrix. Result of selectboost (autoboost, fastboost, ...).
- verbose
Boolean. Defaults to
FALSE.- prop.level
Numeric value. Used to compute the proportion of selection is greater than prop.level. Defaults to
.95.- conf.int.level
Numeric value. Confidence level for confidence intervals on estimated proportions of selection. Defaults to
.95.- conf.threshold
Numeric value. Used to compute the number of steps (c0) for which the proportion of selection remains greater than conf.threshold. Defaults to
.95.- ...
. Passed to the plotting functions.
Details
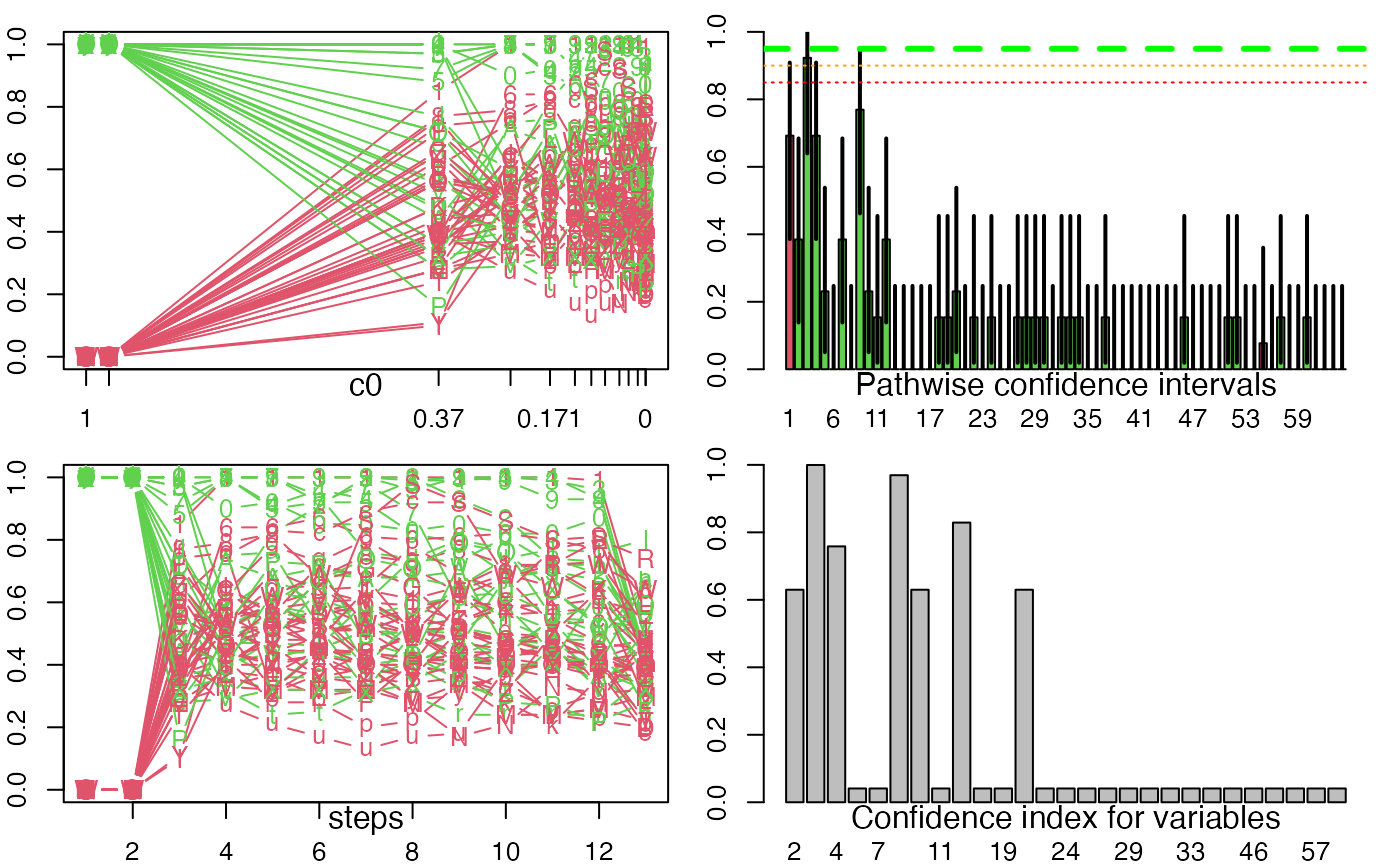
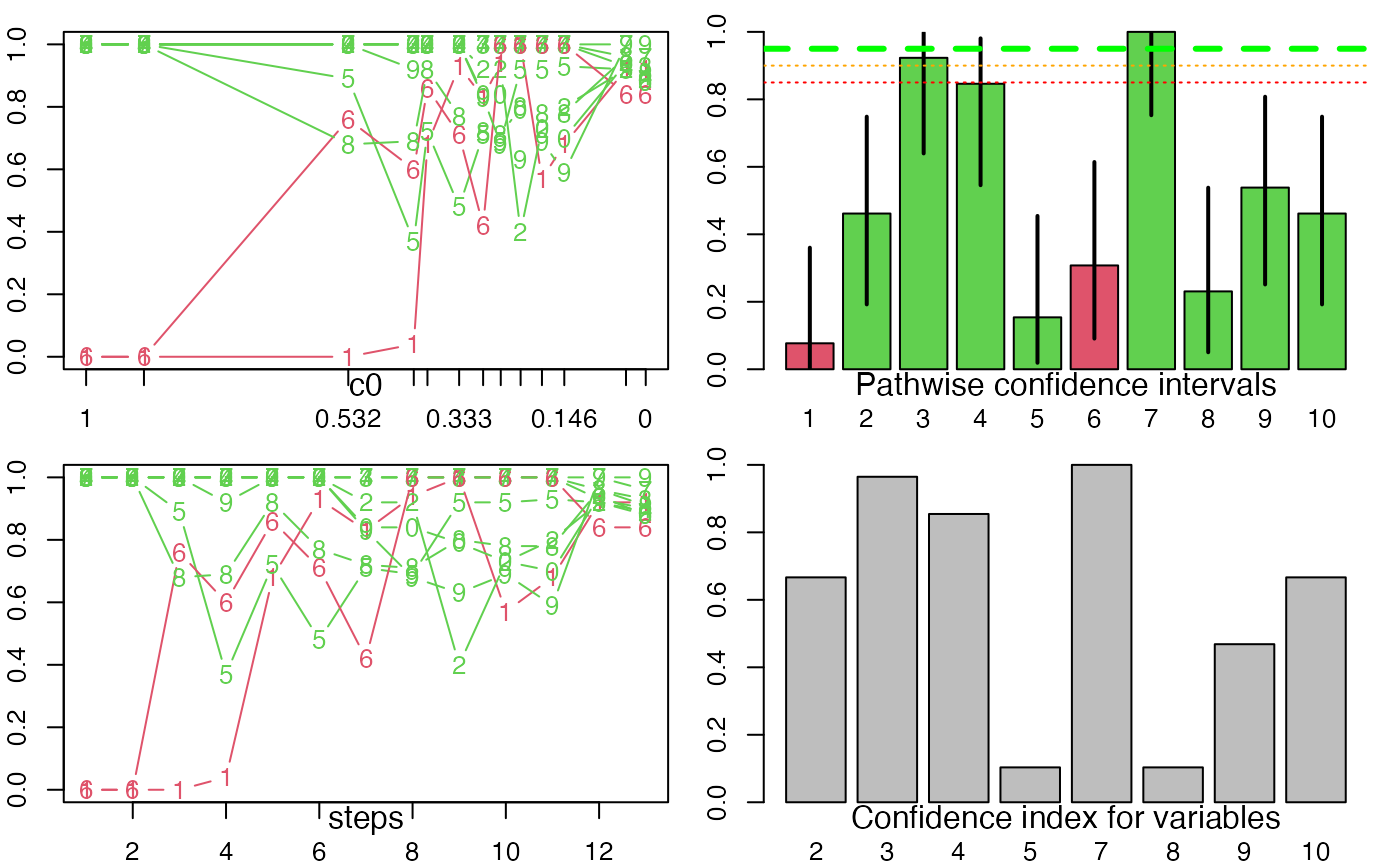
plot.selectboost returns an invisible list and creates four graphics.
Two plots the proportion of selection with respect to c0 (by step or according to real scale).
On the third graph, no bar means a proportion of selection less than prop.level.
Confidence intervals are computed at the conf.int.level level.
Barplot of the confidence index (1-min(c0, such that proportion|c0>conf.threshold)).
References
selectBoost: a general algorithm to enhance the performance of variable selection methods in correlated datasets, Frédéric Bertrand, Ismaïl Aouadi, Nicolas Jung, Raphael Carapito, Laurent Vallat, Seiamak Bahram, Myriam Maumy-Bertrand, Bioinformatics, 2020. doi:10.1093/bioinformatics/btaa855
See also
Other Selectboost analyse functions:
force.non.inc(),
summary.selectboost()
Author
Frederic Bertrand, frederic.bertrand@lecnam.net
Examples
set.seed(314)
xran=matrix(rnorm(75),15,5)
ybin=sample(0:1,15,replace=TRUE)
yran=rnorm(15)
layout(matrix(1:4,2,2))

data(autoboost.res.x)
plot(autoboost.res.x)


data(autoboost.res.x2)
plot(autoboost.res.x2)
#> Warning: default 'pch' is smaller than number of columns and hence recycled
#> Warning: default 'pch' is smaller than number of columns and hence recycled
data(autoboost.res.x2)
plot(autoboost.res.x2)
#> Warning: default 'pch' is smaller than number of columns and hence recycled
#> Warning: default 'pch' is smaller than number of columns and hence recycled