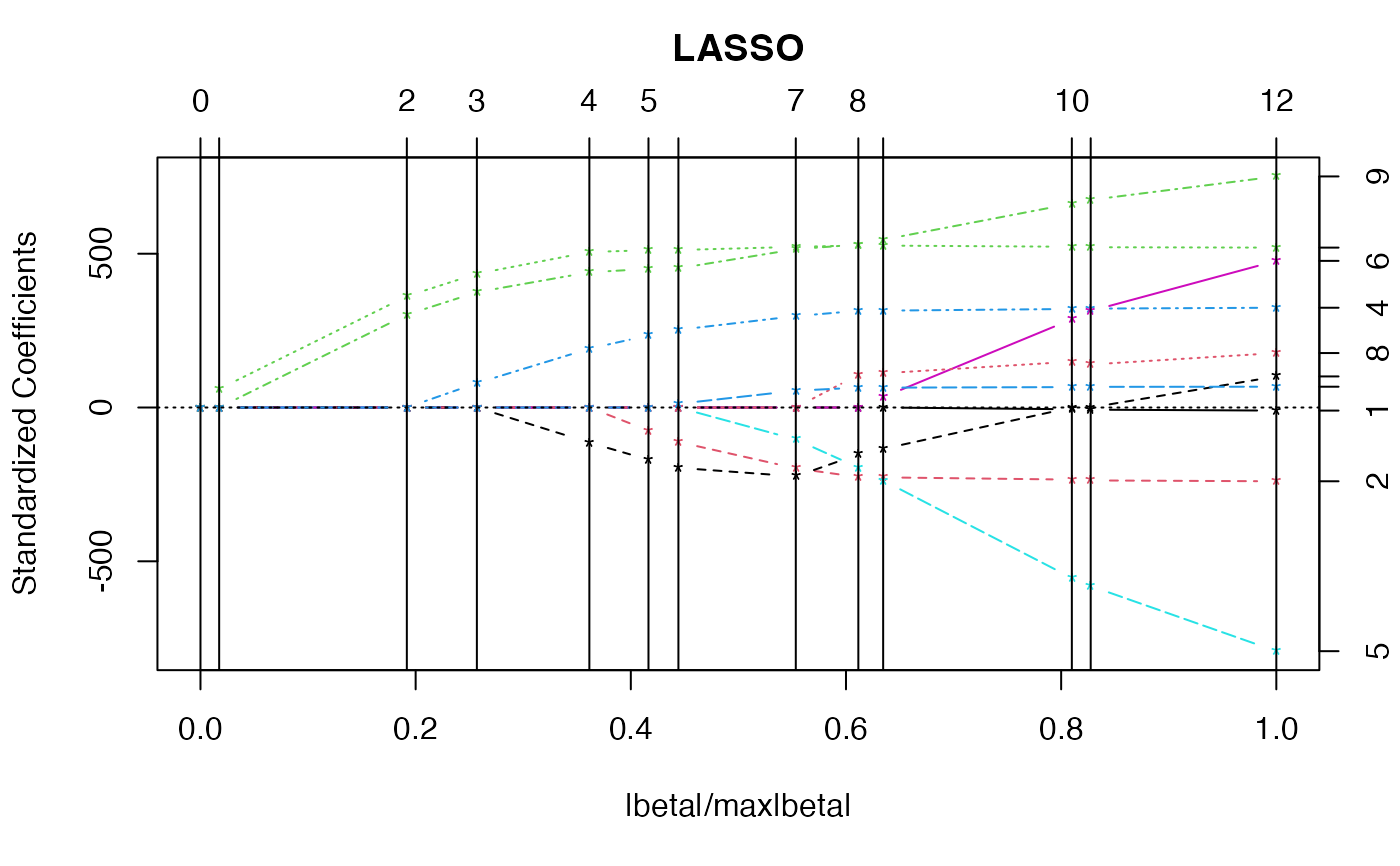
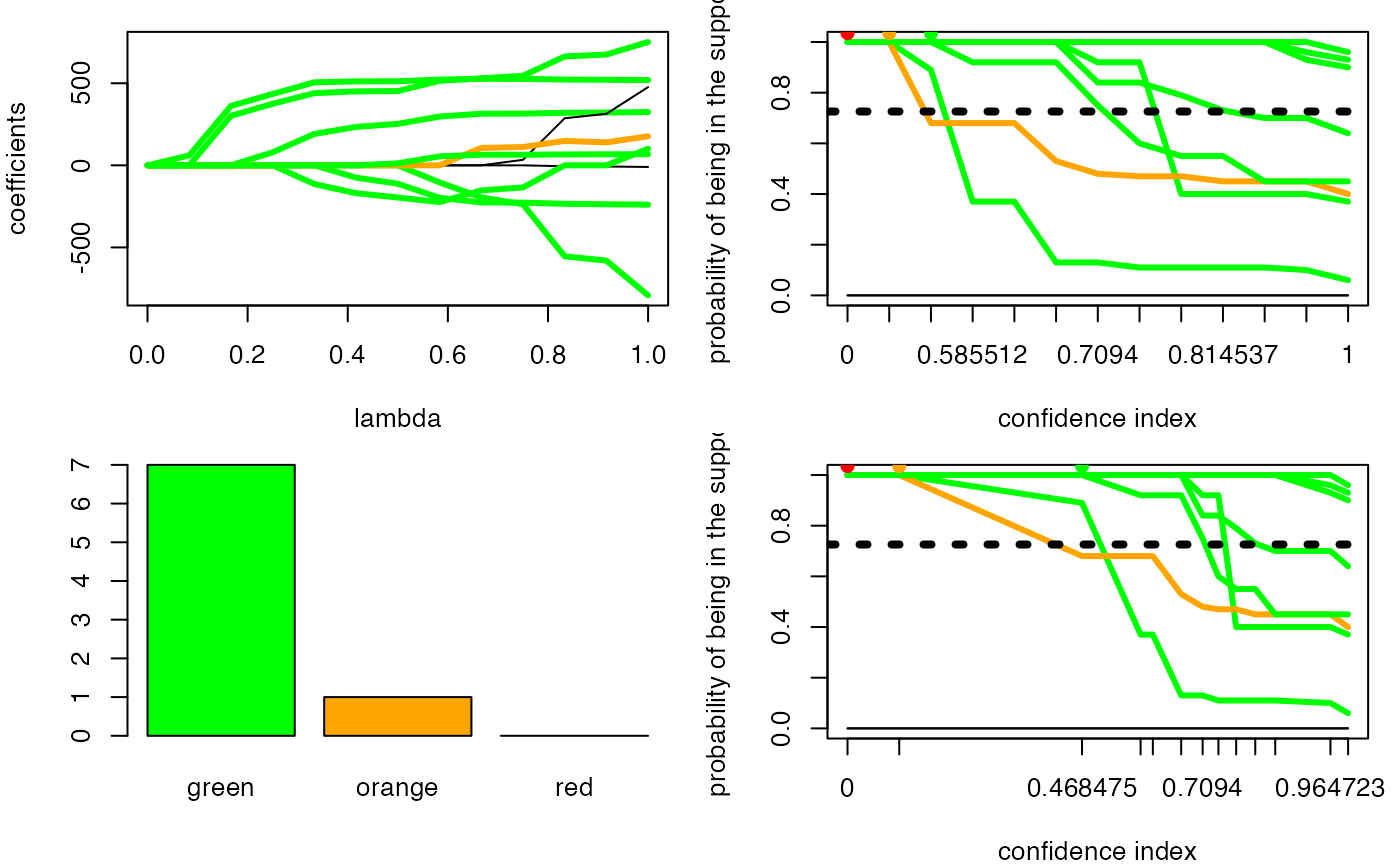
Plot trajectories.
Usage
trajC0(x, ...)

# S3 method for class 'selectboost'
trajC0(
  x,
  summary.selectboost.res,
  lasso.coef.path,
  type.x.axis = "noscale",
  type.graph = "boost",
  threshold.level = NULL,
  ...
)
Arguments
- x
Numerical matrix. Selectboost object.
- ...
. Passed to the plotting functions.
- summary.selectboost.res
List. Summary of selectboost object.
- lasso.coef.path
List. Result of
predict.lars.- type.x.axis
Character value. "scale" or "noscale" for the X axis.
- type.graph
Character value. Type of graphs: "bars", "lasso" and "boost".
- threshold.level
Numeric value. Threshold for the graphs.
References
selectBoost: a general algorithm to enhance the performance of variable selection methods in correlated datasets, Frédéric Bertrand, Ismaïl Aouadi, Nicolas Jung, Raphael Carapito, Laurent Vallat, Seiamak Bahram, Myriam Maumy-Bertrand, Bioinformatics, 2020. doi:10.1093/bioinformatics/btaa855
See also
fastboost, autoboost and summary.selectboost
Other Selectboost analyze functions:
auto.analyze(),
plot.summary.selectboost()
Author
Frederic Bertrand, frederic.bertrand@lecnam.net
Examples
data(autoboost.res.x)
data(diabetes, package="lars")

### With lasso trajectories
m.x<-lars::lars(diabetes$x,diabetes$y)
plot(m.x)

mm.x<-predict(m.x,type="coef",mode="lambda")
autoboost.res.x.mean = summary(autoboost.res.x)

par(mfrow=c(2,2),mar=c(4,4,1,1))
trajC0(autoboost.res.x,autoboost.res.x.mean,lasso.coef.path=mm.x,type.graph="lasso")
trajC0(autoboost.res.x,autoboost.res.x.mean)
trajC0(autoboost.res.x,autoboost.res.x.mean,type.graph="bars")
trajC0(autoboost.res.x,autoboost.res.x.mean,type.x.axis ="scale")

