Benchmarking bigPCAcpp Workflows
Frédéric Bertrand
Source:vignettes/bigPCA-benchmarks.Rmd
bigPCA-benchmarks.RmdOverview
This vignette summarises the performance of the principal component
analysis (PCA) routines provided by bigPCAcpp across
matrices ranging from small to very large dimensions. All experiments
operate on in-memory [bigmemory::big.matrix] objects to
avoid file-backed storage and a baseline using base R’s
[stats::prcomp()] is included for context. A focused
bench::mark() comparison against
[irlba::prcomp_irlba()] is also included for a smaller
dense benchmark.
The large benchmark suite was executed once, and the resulting
dataset is stored in the package as benchmark_results. The
summary analysis below relies on that saved dataset so that the vignette
can be built quickly, while the focused irlba comparison is
evaluated only when its optional benchmark packages are available.
data("benchmark_results", package = "bigPCAcpp")
str(benchmark_results)
#> 'data.frame':    360 obs. of  14 variables:
#>  $ dataset    : chr  "small" "small" "small" "small" ...
#>  $ rows       : int  1000 1000 1000 1000 1000 1000 1000 1000 1000 1000 ...
#>  $ cols       : int  50 50 50 50 50 50 50 50 50 50 ...
#>  $ ncomp      : int  10 10 10 10 10 10 10 10 10 10 ...
#>  $ method     : chr  "classical" "classical" "classical" "classical" ...
#>  $ replicate  : int  1 2 3 4 5 6 7 8 9 10 ...
#>  $ user_time  : num  0.003 0.003 0.002 0.002 0.002 ...
#>  $ system_time: num  0.001 0 0 0 0 0 0 0 0 0 ...
#>  $ elapsed    : num  0.003 0.002 0.002 0.002 0.002 ...
#>  $ success    : logi  TRUE TRUE TRUE TRUE TRUE TRUE ...
#>  $ backend    : chr  "bigmemory" "bigmemory" "bigmemory" "bigmemory" ...
#>  $ iterations : int  NA NA NA NA NA NA NA NA NA NA ...
#>  $ converged  : logi  NA NA NA NA NA NA ...
#>  $ error      : chr  NA NA NA NA ...
How the benchmarks were produced
The following chunk outlines the code that generated the stored results. The chunk is not evaluated when building the vignette to keep compilation times short, but it can be used to reproduce the dataset manually.
suppressPackageStartupMessages({
  library(bigmemory)
  if (requireNamespace("bigPCAcpp", quietly = TRUE)) {
    library(bigPCAcpp)
  } else {
    if (!requireNamespace("pkgload", quietly = TRUE)) {
      stop("bigPCAcpp must be installed or pkgload must be available", call. = FALSE)
    }
    pkgload::load_all(".")
  }
})

sizes <- list(
  small = list(rows = 1000L, cols = 50L),
  medium = list(rows = 5000L, cols = 100L),
  large = list(rows = 20000L, cols = 200L),
  xlarge = list(rows = 50000L, cols = 300L),
  xxlarge = list(rows = 100000L, cols = 500L),
  xxxlarge = list(rows = 100000L, cols = 2000L)
)

method_runners <- list(
  classical = function(mats, ncomp) {
    pca_bigmatrix(mats$big, center = TRUE, scale = TRUE, ncomp = ncomp)
  },
  streaming = function(mats, ncomp) {
    pca_stream_bigmatrix(mats$big, center = TRUE, scale = TRUE, ncomp = ncomp)
  },
  scalable = function(mats, ncomp) {
    pca_spca(
      mats$big,
      ncomp = ncomp,
      center = TRUE,
      scale = TRUE,
      block_size = 2048L,
      max_iter = 25L,
      tol = 1e-4,
      seed = 42L,
      return_scores = FALSE,
      verbose = FALSE
    )
  },
  prcomp = function(mats, ncomp) {
    stats::prcomp(
      mats$dense,
      center = TRUE,
      scale. = TRUE,
      rank. = ncomp
    )
  }
)

replicates_for <- function(rows) {
  if (rows <= 5000L) {
    20L
  } else if (rows <= 20000L) {
    20L
  } else {
    10L
  }
}

results <- list()
row_id <- 1L
set.seed(123)

for (dataset_name in names(sizes)) {
  dims <- sizes[[dataset_name]]
  message(sprintf("Generating dataset '%s' with %d rows and %d columns", dataset_name, dims$rows, dims$cols))
  mat <- matrix(rnorm(dims$rows * dims$cols), nrow = dims$rows, ncol = dims$cols)
  big_mat <- bigmemory::as.big.matrix(mat, type = "double")
  ncomp <- min(10L, dims$cols)
  reps <- replicates_for(dims$rows)
  inputs <- list(dense = mat, big = big_mat)

  for (method_name in names(method_runners)) {
    runner <- method_runners[[method_name]]
    for (rep in seq_len(reps)) {
      gc()
      gc()
      message(sprintf("Running %s (replicate %d/%d) on %s", method_name, rep, reps, dataset_name))
      res <- NULL
      timing <- system.time({
        res <<- tryCatch(
          runner(inputs, ncomp),
          error = function(e) e
        )
      })
      success <- !inherits(res, "error")
      backend <- if (success) {
        backend_val <- attr(res, "backend", exact = TRUE)
        if (is.null(backend_val) && !is.null(res$backend)) {
          res$backend
        } else {
          backend_val
        }
      } else {
        NA_character_
      }
      iterations <- if (success) {
        iter <- attr(res, "iterations", exact = TRUE)
        if (is.null(iter)) NA_integer_ else as.integer(iter)
      } else {
        NA_integer_
      }
      converged <- if (success) {
        conv <- attr(res, "converged", exact = TRUE)
        if (is.null(conv)) NA else as.logical(conv)
      } else {
        NA
      }
      results[[row_id]] <- data.frame(
        dataset = dataset_name,
        rows = dims$rows,
        cols = dims$cols,
        ncomp = ncomp,
        method = method_name,
        replicate = rep,
        user_time = unname(timing[["user.self"]]),
        system_time = unname(timing[["sys.self"]]),
        elapsed = unname(timing[["elapsed"]]),
        success = success,
        backend = if (is.null(backend)) NA_character_ else as.character(backend),
        iterations = iterations,
        converged = converged,
        error = if (success) NA_character_ else conditionMessage(res),
        stringsAsFactors = FALSE
      )
      row_id <- row_id + 1L
    }
  }
  rm(mat, big_mat)
  gc()
  gc()
}

benchmark_results <- do.call(rbind, results)

if (!dir.exists("data")) {
  dir.create("data")
}

save(benchmark_results, file = file.path("data", "benchmark_results.rda"), compress = "bzip2")
Focused comparison with irlba
The large benchmark suite above uses repeated
system.time() calls so it scales to very large matrices.
For a smaller in-memory problem, the script
scripts/run_benchmark_irlba.R provides a higher-resolution
comparison between pca_bigmatrix() and
[irlba::prcomp_irlba()] using
bench::mark().
set.seed(2025)
bm <- bigmemory::big.matrix(nrow = 2500, ncol = 40, type = "double")
m <- matrix(rnorm(2500 * 40), nrow = 2500)
bm[,] <- m

bench::mark(
  bigpca = bigPCAcpp::pca_bigmatrix(
    bm,
    center = TRUE,
    scale = TRUE,
    ncomp = 4
  )$dev,
  irlba = irlba::prcomp_irlba(
    m,
    n = 4,
    center = TRUE,
    scale. = TRUE
  )$dev,
  min_iterations = 200
)
#> # A tibble: 2 × 6
#>   expression      min   median `itr/sec` mem_alloc `gc/sec`
#>   <bch:expr> <bch:tm> <bch:tm>     <dbl> <bch:byt>    <dbl>
#> 1 bigpca     372.94µs  476.4µs     2096.   98.85KB     2.00
#> 2 irlba        2.39ms   2.69ms      369.    2.79MB    23.5
Summary statistics
Only successful runs are retained for the summaries. Replicate counts vary with matrix size (twenty runs for matrices up to 20,000 rows then tens runs).
successful <- benchmark_results[benchmark_results$success, ]
method_levels <- c("prcomp", "classical", "streaming", "scalable")
successful$method <- factor(successful$method, levels = method_levels, ordered = TRUE)
mean_user_time <- aggregate(user_time ~ dataset + method, successful, mean)
colnames(mean_user_time)[colnames(mean_user_time) == "user_time"] <- "mean_user_time"

sd_user_time <- aggregate(user_time ~ dataset + method, successful, sd)
colnames(sd_user_time)[colnames(sd_user_time) == "user_time"] <- "sd_user_time"

rep_counts <- aggregate(replicate ~ dataset + method, successful, length)
colnames(rep_counts)[colnames(rep_counts) == "replicate"] <- "n_runs"

summary_table <- Reduce(
  function(x, y) merge(x, y, by = c("dataset", "method"), all = TRUE),
  list(mean_user_time, sd_user_time, rep_counts)
)

summary_table$sd_user_time[summary_table$n_runs <= 1] <- NA_real_
summary_table$method <- factor(summary_table$method, levels = method_levels)

mean_user_time$dataset <- factor(mean_user_time$dataset,levels = c("small", "medium", "large", "xlarge", "xxlarge", "xxxlarge"),ordered = TRUE)

summary_table <- summary_table[order(summary_table$dataset,summary_table$method),]
knitr::kable(
  summary_table,
  digits = 3,
  caption = "user_time time summaries (seconds) by dataset size and method."
)| dataset | method | mean_user_time | sd_user_time | n_runs | |
|---|---|---|---|---|---|
| 2 | large | prcomp | 1.861 | 0.031 | 20 |
| 1 | large | classical | 0.477 | 0.001 | 20 |
| 4 | large | streaming | 0.477 | 0.001 | 20 |
| 3 | large | scalable | 1.623 | 0.006 | 20 |
| 6 | medium | prcomp | 0.115 | 0.001 | 20 |
| 5 | medium | classical | 0.031 | 0.000 | 20 |
| 8 | medium | streaming | 0.031 | 0.000 | 20 |
| 7 | medium | scalable | 0.199 | 0.000 | 20 |
| 10 | small | prcomp | 0.007 | 0.000 | 20 |
| 9 | small | classical | 0.002 | 0.000 | 20 |
| 12 | small | streaming | 0.002 | 0.000 | 20 |
| 11 | small | scalable | 0.020 | 0.000 | 20 |
| 14 | xlarge | prcomp | 10.249 | 0.029 | 10 |
| 13 | xlarge | classical | 2.665 | 0.004 | 10 |
| 16 | xlarge | streaming | 2.667 | 0.012 | 10 |
| 15 | xlarge | scalable | 6.128 | 0.012 | 10 |
| 18 | xxlarge | prcomp | 54.970 | 0.563 | 10 |
| 17 | xxlarge | classical | 14.744 | 0.085 | 10 |
| 20 | xxlarge | streaming | 14.949 | 0.208 | 10 |
| 19 | xxlarge | scalable | 20.850 | 0.280 | 10 |
| 22 | xxxlarge | prcomp | 843.754 | 3.599 | 10 |
| 21 | xxxlarge | classical | 243.675 | 1.836 | 10 |
| 24 | xxxlarge | streaming | 243.400 | 0.360 | 10 |
| 23 | xxxlarge | scalable | 82.468 | 0.540 | 10 |
summary_table2 <- summary_table[order(summary_table$method,summary_table$dataset),]
knitr::kable(
  summary_table2,
  digits = 3,
  caption = "user_time time summaries (seconds) by dataset size and method."
)| dataset | method | mean_user_time | sd_user_time | n_runs | |
|---|---|---|---|---|---|
| 2 | large | prcomp | 1.861 | 0.031 | 20 |
| 6 | medium | prcomp | 0.115 | 0.001 | 20 |
| 10 | small | prcomp | 0.007 | 0.000 | 20 |
| 14 | xlarge | prcomp | 10.249 | 0.029 | 10 |
| 18 | xxlarge | prcomp | 54.970 | 0.563 | 10 |
| 22 | xxxlarge | prcomp | 843.754 | 3.599 | 10 |
| 1 | large | classical | 0.477 | 0.001 | 20 |
| 5 | medium | classical | 0.031 | 0.000 | 20 |
| 9 | small | classical | 0.002 | 0.000 | 20 |
| 13 | xlarge | classical | 2.665 | 0.004 | 10 |
| 17 | xxlarge | classical | 14.744 | 0.085 | 10 |
| 21 | xxxlarge | classical | 243.675 | 1.836 | 10 |
| 4 | large | streaming | 0.477 | 0.001 | 20 |
| 8 | medium | streaming | 0.031 | 0.000 | 20 |
| 12 | small | streaming | 0.002 | 0.000 | 20 |
| 16 | xlarge | streaming | 2.667 | 0.012 | 10 |
| 20 | xxlarge | streaming | 14.949 | 0.208 | 10 |
| 24 | xxxlarge | streaming | 243.400 | 0.360 | 10 |
| 3 | large | scalable | 1.623 | 0.006 | 20 |
| 7 | medium | scalable | 0.199 | 0.000 | 20 |
| 11 | small | scalable | 0.020 | 0.000 | 20 |
| 15 | xlarge | scalable | 6.128 | 0.012 | 10 |
| 19 | xxlarge | scalable | 20.850 | 0.280 | 10 |
| 23 | xxxlarge | scalable | 82.468 | 0.540 | 10 |
Visual comparison
The plot below compares the average elapsed user time for each method across the simulated datasets. Error bars denote one standard deviation when multiple replicates are available.
if (requireNamespace("ggplot2", quietly = TRUE)) {
  library(ggplot2)
  plot_data <- summary_table
  plot_data$dataset <- factor(plot_data$dataset, levels = c("small", "medium", "large", "xlarge", "xxlarge", "xxxlarge"),ordered = TRUE)
  plot_data$method <- factor(plot_data$method, levels = method_levels)

  ggplot(plot_data, aes(x = dataset, y = mean_user_time, colour = method, group = method)) +
    geom_line() +
    geom_point(size = 2) +
    geom_errorbar(
      aes(ymin = mean_user_time - sd_user_time, ymax = mean_user_time + sd_user_time),
      width = 0.1,
      na.rm = TRUE
    ) +
    labs(
      x = "Dataset size",
      y = "Mean user_time time (s)",
      colour = "Method",
      title = "Performance of bigPCAcpp PCA routines",
      subtitle = "All benchmarks run on in-memory big.matrix objects"
    ) +
    theme_minimal()

    ggplot(plot_data, aes(x = method, y = mean_user_time, colour = dataset, group = dataset)) +
    geom_line() +
    geom_point(size = 2) +
    geom_errorbar(
      aes(ymin = mean_user_time - sd_user_time, ymax = mean_user_time + sd_user_time),
      width = 0.1,
      na.rm = TRUE
    ) +
    labs(
      x = "Dataset size",
      y = "Mean user_time time (s)",
      colour = "Method",
      title = "Performance of bigPCAcpp PCA routines",
      subtitle = "All benchmarks run on in-memory big.matrix objects"
    ) +
    theme_minimal()
} else {
  message("ggplot2 is not installed; skipping the benchmark plot.")
}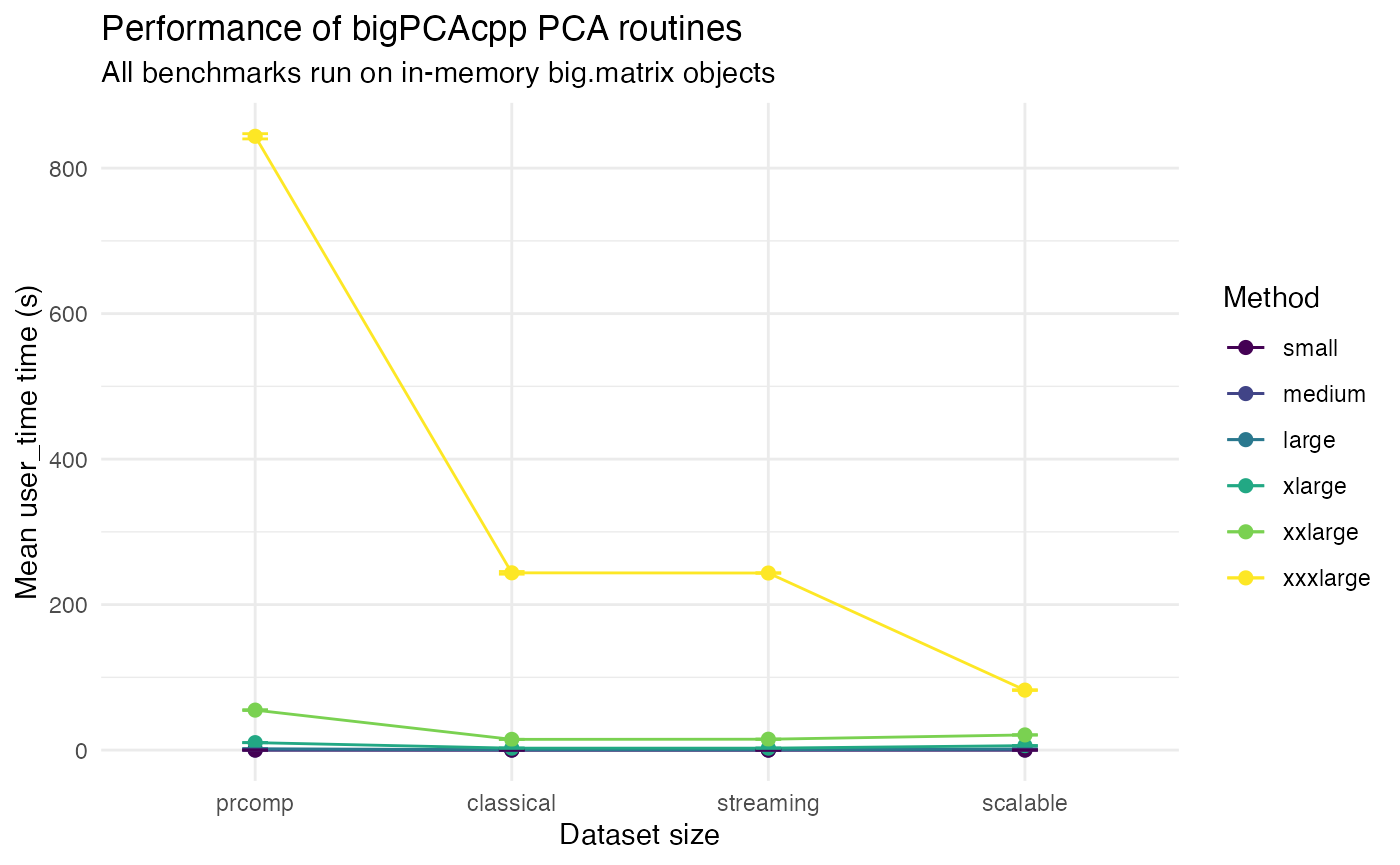
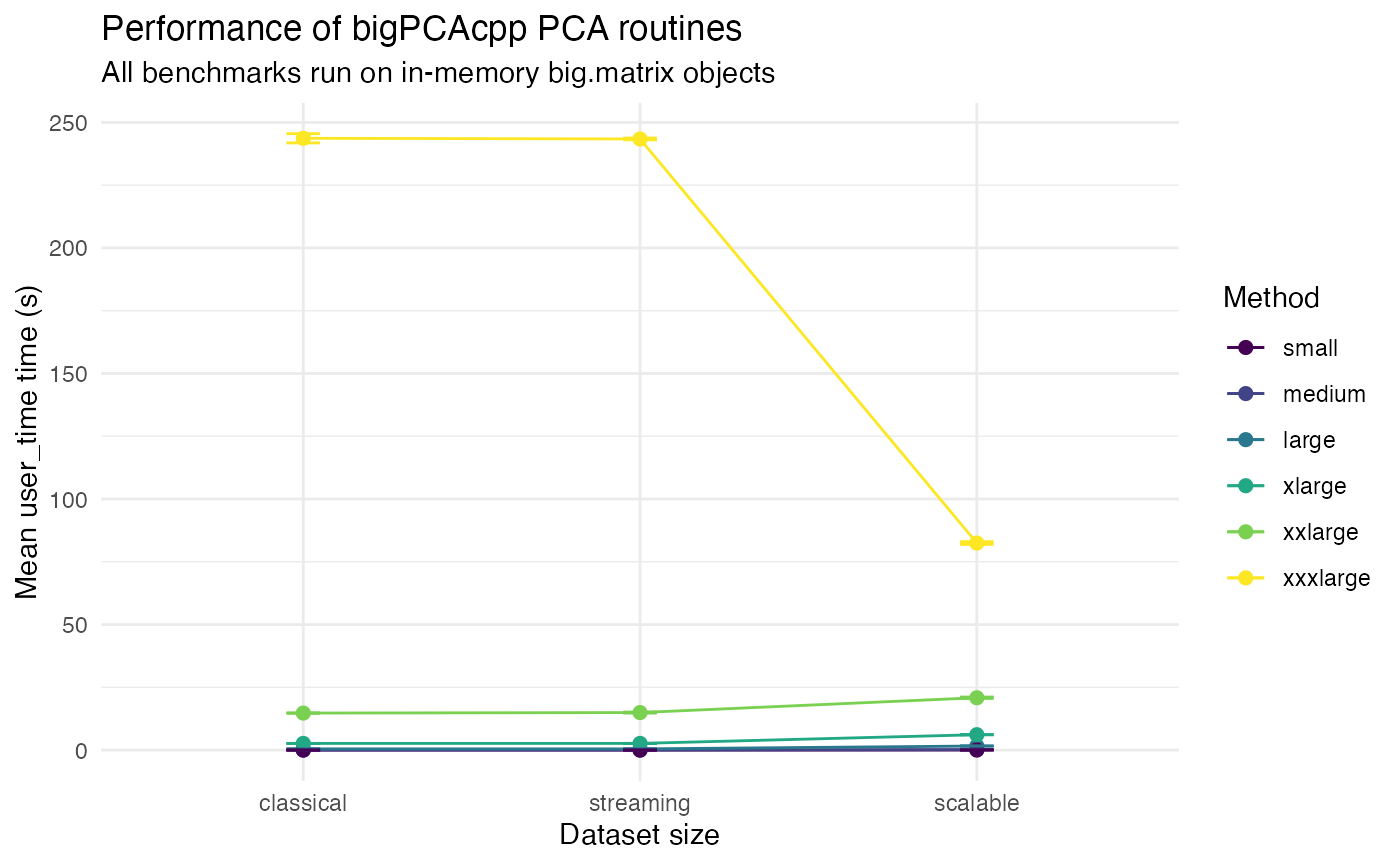
Without the prcomp baseline to zoom on the results of
the three other algorithms.
if (requireNamespace("ggplot2", quietly = TRUE)) {
  library(ggplot2)
  plot_data <- subset(summary_table, summary_table$method!="prcomp")
  plot_data$dataset <- factor(plot_data$dataset, levels = c("small", "medium", "large", "xlarge", "xxlarge", "xxxlarge"),ordered = TRUE)
  plot_data$method <- factor(plot_data$method, levels = method_levels)

  ggplot(plot_data, aes(x = dataset, y = mean_user_time, colour = method, group = method)) +
    geom_line() +
    geom_point(size = 2) +
    geom_errorbar(
      aes(ymin = mean_user_time - sd_user_time, ymax = mean_user_time + sd_user_time),
      width = 0.1,
      na.rm = TRUE
    ) +
    labs(
      x = "Dataset size",
      y = "Mean user_time time (s)",
      colour = "Method",
      title = "Performance of bigPCAcpp PCA routines",
      subtitle = "All benchmarks run on in-memory big.matrix objects"
    ) +
    theme_minimal()

    ggplot(plot_data, aes(x = method, y = mean_user_time, colour = dataset, group = dataset)) +
    geom_line() +
    geom_point(size = 2) +
    geom_errorbar(
      aes(ymin = mean_user_time - sd_user_time, ymax = mean_user_time + sd_user_time),
      width = 0.1,
      na.rm = TRUE
    ) +
    labs(
      x = "Dataset size",
      y = "Mean user_time time (s)",
      colour = "Method",
      title = "Performance of bigPCAcpp PCA routines",
      subtitle = "All benchmarks run on in-memory big.matrix objects"
    ) +
    theme_minimal()
} else {
  message("ggplot2 is not installed; skipping the benchmark plot.")
}
Session information
sessionInfo()
#> R version 4.5.2 (2025-10-31)
#> Platform: aarch64-apple-darwin20
#> Running under: macOS Sonoma 14.7.1
#>
#> Matrix products: default
#> BLAS:   /System/Library/Frameworks/Accelerate.framework/Versions/A/Frameworks/vecLib.framework/Versions/A/libBLAS.dylib
#> LAPACK: /Library/Frameworks/R.framework/Versions/4.5-arm64/Resources/lib/libRlapack.dylib;  LAPACK version 3.12.1
#>
#> locale:
#> [1] en_US.UTF-8/en_US.UTF-8/en_US.UTF-8/C/en_US.UTF-8/en_US.UTF-8
#>
#> time zone: Europe/Paris
#> tzcode source: internal
#>
#> attached base packages:
#> [1] stats     graphics  grDevices utils     datasets  methods   base
#>
#> other attached packages:
#> [1] ggplot2_4.0.2
#>
#> loaded via a namespace (and not attached):
#>  [1] sass_0.4.10         utf8_1.2.6          generics_0.1.4
#>  [4] lattice_0.22-7      bigmemory_4.6.4     digest_0.6.39
#>  [7] magrittr_2.0.4      evaluate_1.0.5      grid_4.5.2
#> [10] RColorBrewer_1.1-3  fastmap_1.2.0       jsonlite_2.0.0
#> [13] Matrix_1.7-4        bench_1.1.4         bigmemory.sri_0.1.8
#> [16] viridisLite_0.4.3   scales_1.4.0        textshaping_1.0.4
#> [19] jquerylib_0.1.4     cli_3.6.5           rlang_1.1.7
#> [22] bigPCAcpp_0.9.1     withr_3.0.2         cachem_1.1.0
#> [25] yaml_2.3.12         otel_0.2.0          tools_4.5.2
#> [28] uuid_1.2-2          dplyr_1.2.0         profmem_0.7.0
#> [31] vctrs_0.7.1         R6_2.6.1            lifecycle_1.0.5
#> [34] fs_1.6.6            htmlwidgets_1.6.4   ragg_1.5.0
#> [37] irlba_2.3.7         pkgconfig_2.0.3     desc_1.4.3
#> [40] pkgdown_2.2.0       pillar_1.11.1       bslib_0.10.0
#> [43] gtable_0.3.6        glue_1.8.0          Rcpp_1.1.1
#> [46] systemfonts_1.3.1   xfun_0.56           tibble_3.3.1
#> [49] tidyselect_1.2.1    rstudioapi_0.18.0   knitr_1.51
#> [52] farver_2.1.2        htmltools_0.5.9     labeling_0.4.3
#> [55] rmarkdown_2.30      compiler_4.5.2      S7_0.2.1