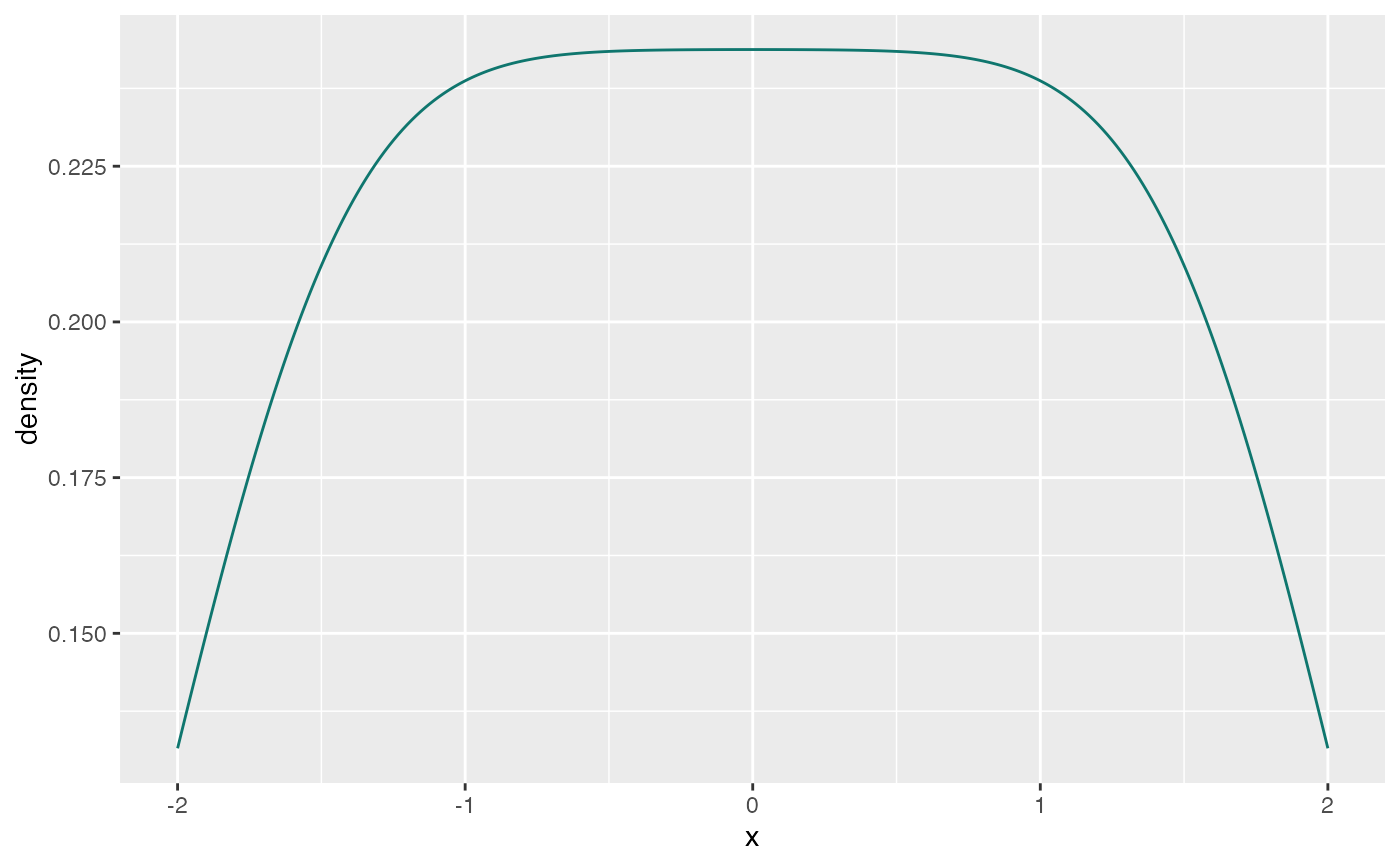
Add a density curve layer tagged for the ggWebGL renderer. Density
estimation is delegated to ggplot2::StatDensity; this geom serializes the
resulting curve as a line path. Filled densities are not rendered by this
layer.
Usage
geom_density_webgl(
  mapping = NULL,
  data = NULL,
  stat = "density",
  position = "identity",
  ...,
  outline.type = "upper",
  lineend = "butt",
  linejoin = "round",
  linemitre = 10,
  na.rm = FALSE,
  show.legend = NA,
  inherit.aes = TRUE
)
Arguments
- mapping
Set of aesthetic mappings created by
aes(). If specified andinherit.aes = TRUE(the default), it is combined with the default mapping at the top level of the plot. You must supplymappingif there is no plot mapping.- data
The data to be displayed in this layer. There are three options:
If
NULL, the default, the data is inherited from the plot data as specified in the call toggplot().A
data.frame, or other object, will override the plot data. All objects will be fortified to produce a data frame. Seefortify()for which variables will be created.A
functionwill be called with a single argument, the plot data. The return value must be adata.frame, and will be used as the layer data. Afunctioncan be created from aformula(e.g.~ head(.x, 10)).- stat
Statistical transformation to use. Defaults to
"density"soggplot2computes density curves before WebGL serialization.- position
A position adjustment to use on the data for this layer. This can be used in various ways, including to prevent overplotting and improving the display. The
positionargument accepts the following:The result of calling a position function, such as
position_jitter(). This method allows for passing extra arguments to the position.A string naming the position adjustment. To give the position as a string, strip the function name of the
position_prefix. For example, to useposition_jitter(), give the position as"jitter".For more information and other ways to specify the position, see the layer position documentation.
- ...
Additional arguments forwarded through
ggplot2::layer(), includingggplot2::stat_density()parameters such asadjust,kernel,n,trim,bounds, andbw, plus static aesthetics.- outline.type
Type of the outline of the area;
"both"draws both the upper and lower lines,"upper"/"lower"draws the respective lines only."full"draws a closed polygon around the area.- lineend
Line end style (round, butt, square).
- linejoin
Line join style (round, mitre, bevel).
- linemitre
Line mitre limit (number greater than 1).
- na.rm
If
FALSE, the default, missing values are removed with a warning. IfTRUE, missing values are silently removed.- show.legend
logical. Should this layer be included in the legends?
NA, the default, includes if any aesthetics are mapped.FALSEnever includes, andTRUEalways includes. It can also be a named logical vector to finely select the aesthetics to display. To include legend keys for all levels, even when no data exists, useTRUE. IfNA, all levels are shown in legend, but unobserved levels are omitted.- inherit.aes
If
FALSE, overrides the default aesthetics, rather than combining with them. This is most useful for helper functions that define both data and aesthetics and shouldn't inherit behaviour from the default plot specification, e.g.annotation_borders().
Examples
values <- data.frame(x = seq(-2, 2, length.out = 40))

ggplot2::ggplot(values, ggplot2::aes(x)) +
  geom_density_webgl(colour = "#0f766e")