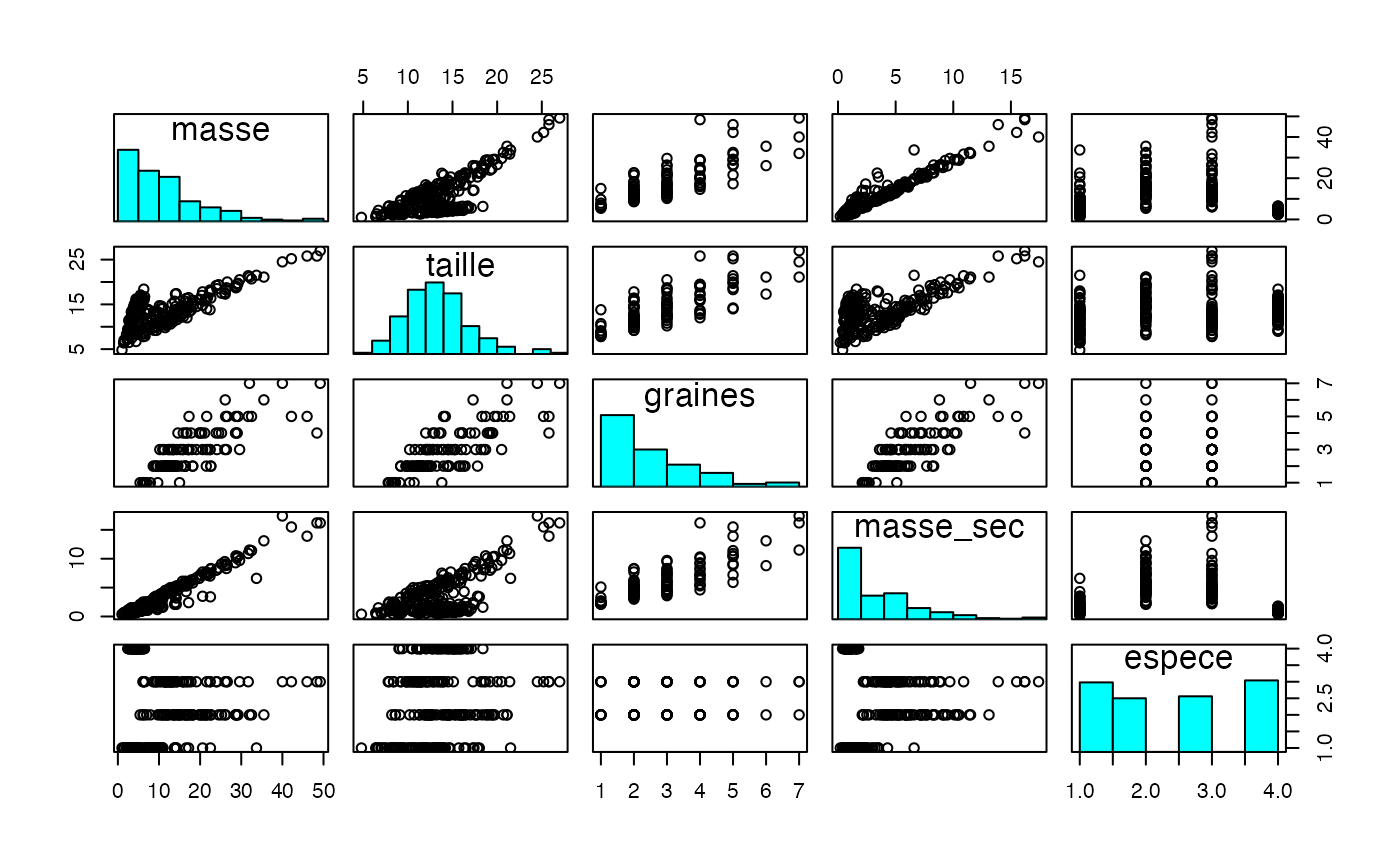
Sert à représenter des histogrammes dans les graphiques matriciels
References
F. Bertrand, M. Maumy-Bertrand, Initiation à la Statistique avec R, Dunod, 4ème édition, 2023.
Author
Frédéric Bertrand
frederic.bertrand@lecnam.net
https://fbertran.github.io/homepage/
Maumy-Bertrand
myriam.maumy@ehesp.fr
https://www.ehesp.fr/annuaire/enseignement-recherche/myriam-maumy/

