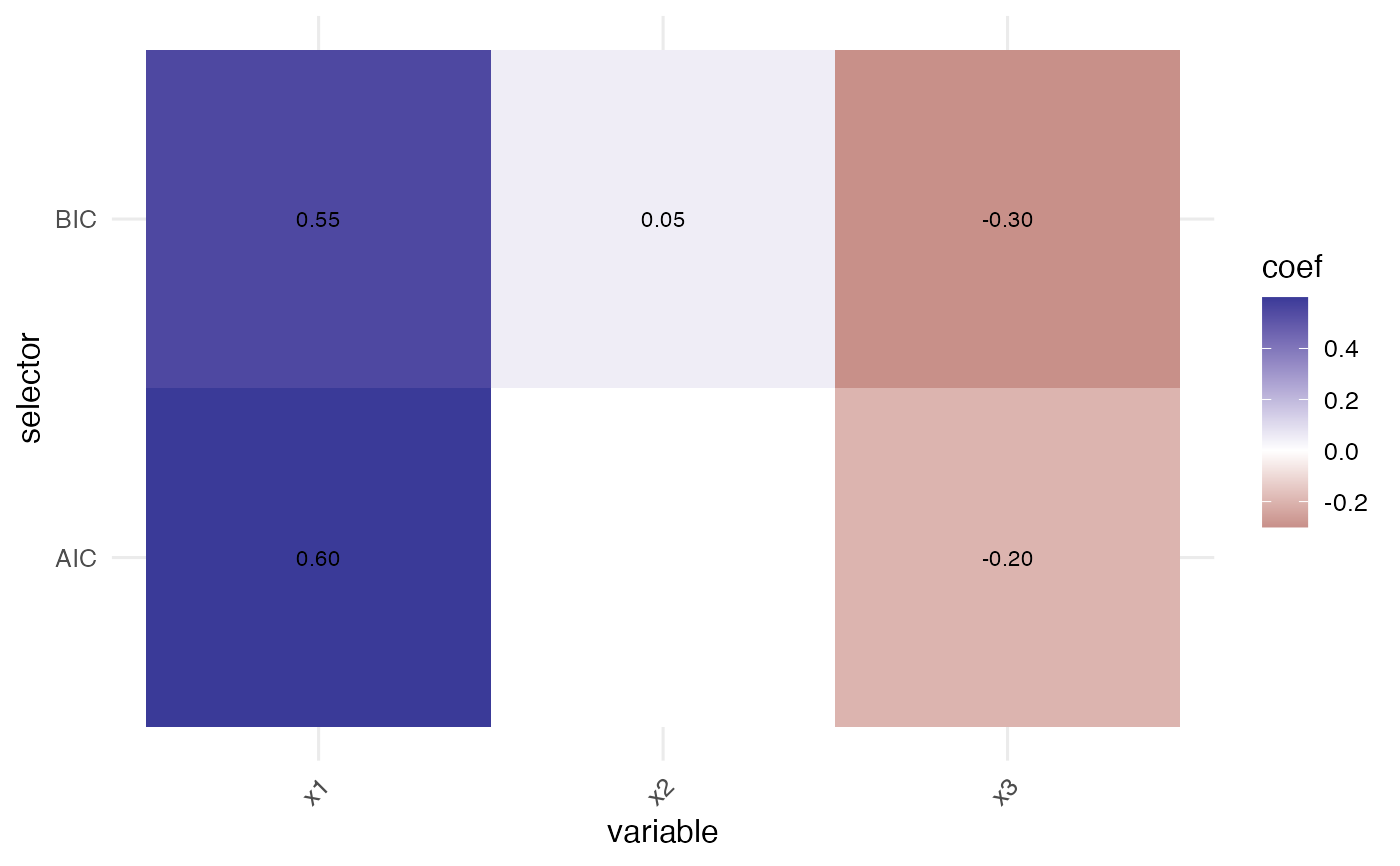
Visual comparison of coefficients returned by each selector. Requires ggplot2.
Usage
plot_compare_coeff(single_tab)
Arguments
- single_tab
Data frame as returned by compare_selectors_single()[["table"]].
Value
A ggplot object when ggplot2 is available; otherwise draws a base R image.
Examples
demo_tab <- data.frame(
  selector = rep(c("AIC", "BIC"), each = 3),
  variable = rep(paste0("x", 1:3), times = 2),
  coef = c(0.6, 0, -0.2, 0.55, 0.05, -0.3)
)
demo_tab$selected <- demo_tab$coef != 0
plot_compare_coeff(demo_tab)