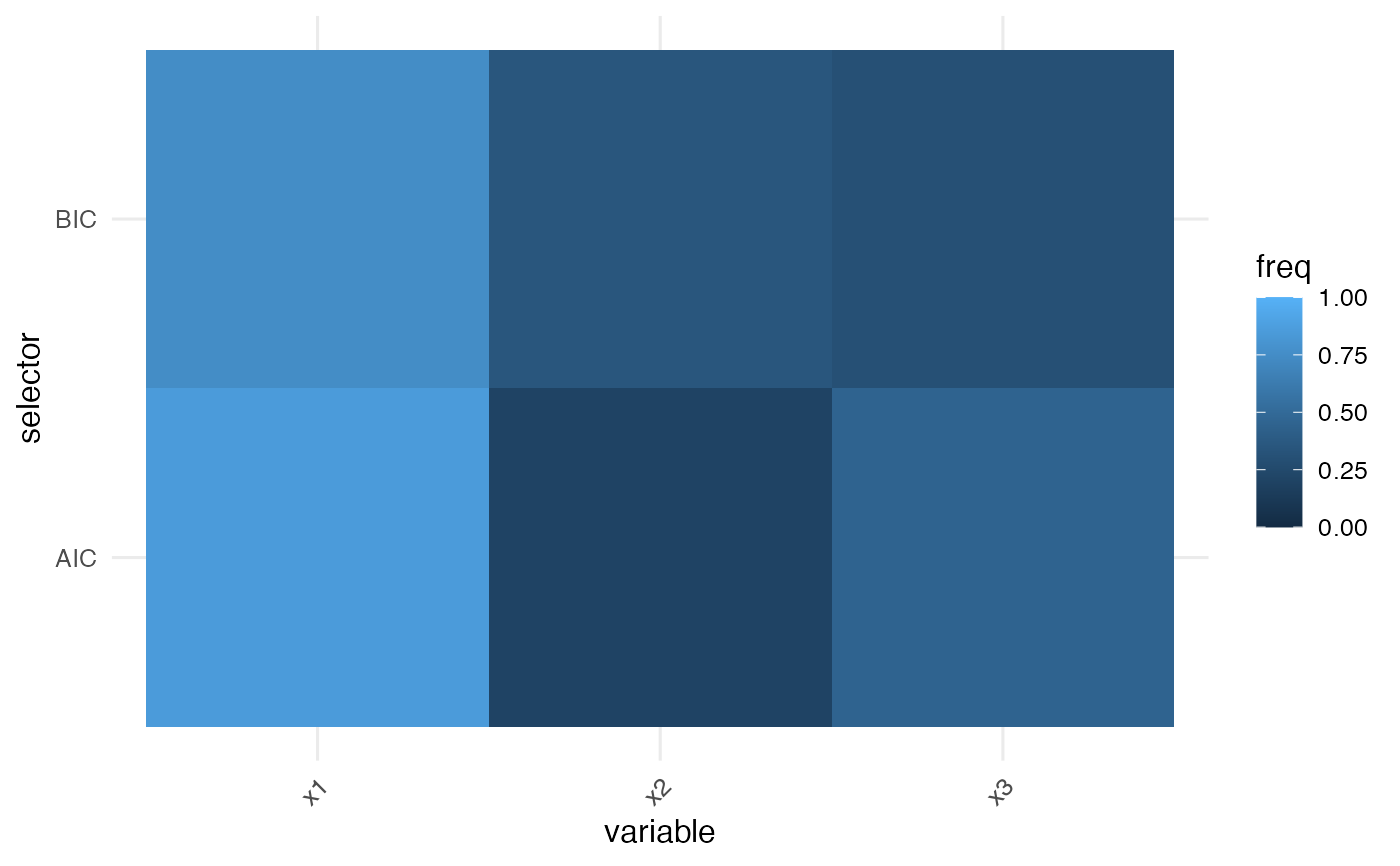
Visual comparison of bootstrap selection frequencies by selector. Requires ggplot2.
Arguments
- freq_tab
Data frame as returned by
compare_selectors_bootstrap().
Visual comparison of bootstrap selection frequencies by selector. Requires ggplot2.
Data frame as returned by compare_selectors_bootstrap().