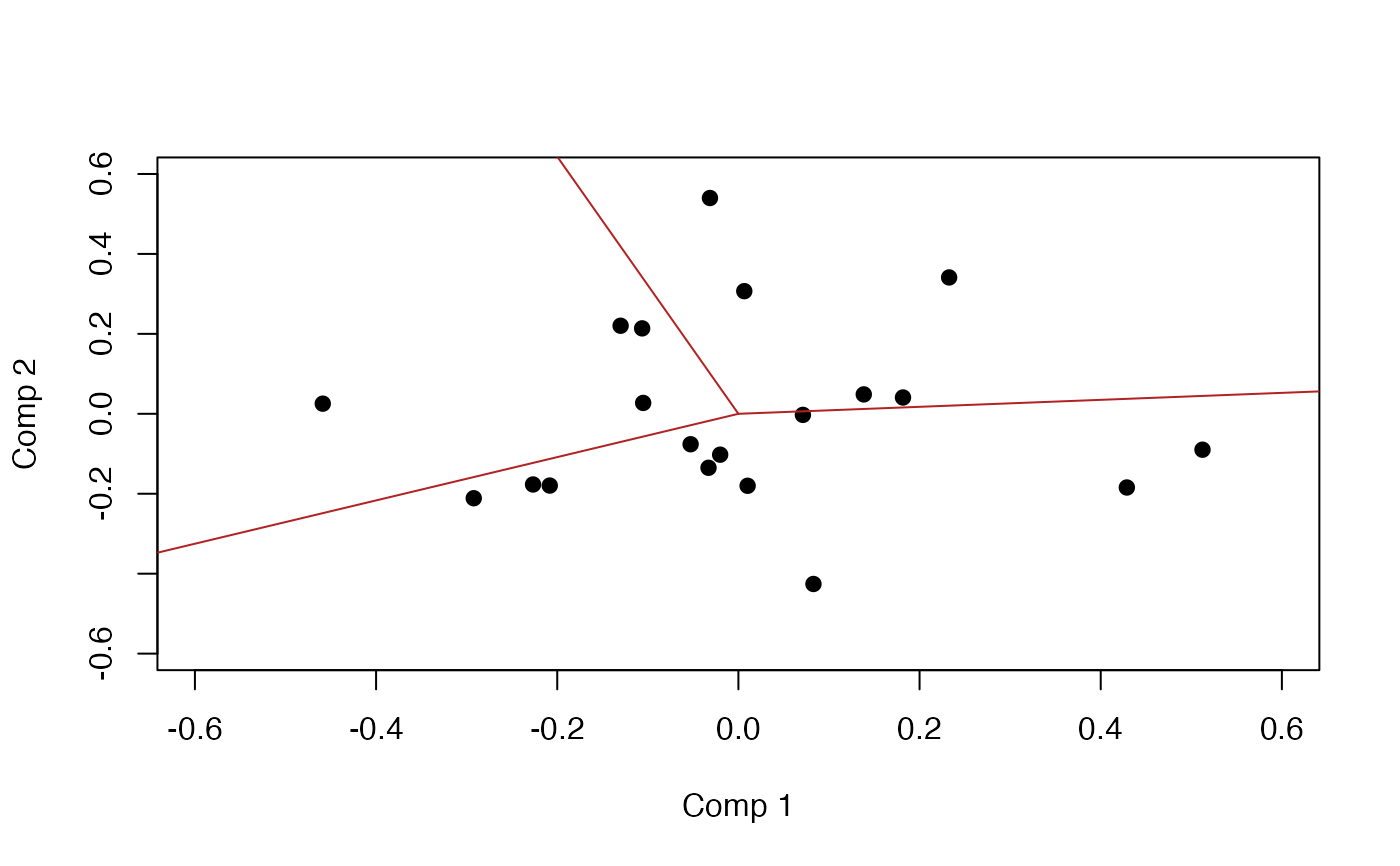
PLS biplot
Usage
plot_pls_biplot(
  object,
  comps = c(1L, 2L),
  scale_variables = 1,
  circle = TRUE,
  circle_col = "grey85",
  arrow_col = "firebrick",
  groups = NULL,
  ellipse = TRUE,
  ellipse_level = 0.95,
  ellipse_n = 200L,
  group_col = NULL,
  ...
)
Arguments
- object
A fitted PLS model with scores and loadings.
- comps
Components to display.
- scale_variables
Scaling factor applied to variable loadings.
- circle
Logical; draw a unit circle behind loadings.
- circle_col
Colour of the unit circle guide.
- arrow_col
Colour for loading arrows.
- groups
Optional factor or character vector defining groups for individuals. When supplied, group-specific colours are used and, if
ellipse = TRUE, confidence ellipses are drawn for each group.- ellipse
Logical; draw group confidence ellipses when
groupsare provided.- ellipse_level
Confidence level for group ellipses (between 0 and 1).
- ellipse_n
Number of points used to draw each ellipse.
- group_col
Optional vector of colours for the groups. Recycled as needed.
- ...
Additional arguments passed to
graphics::plot().