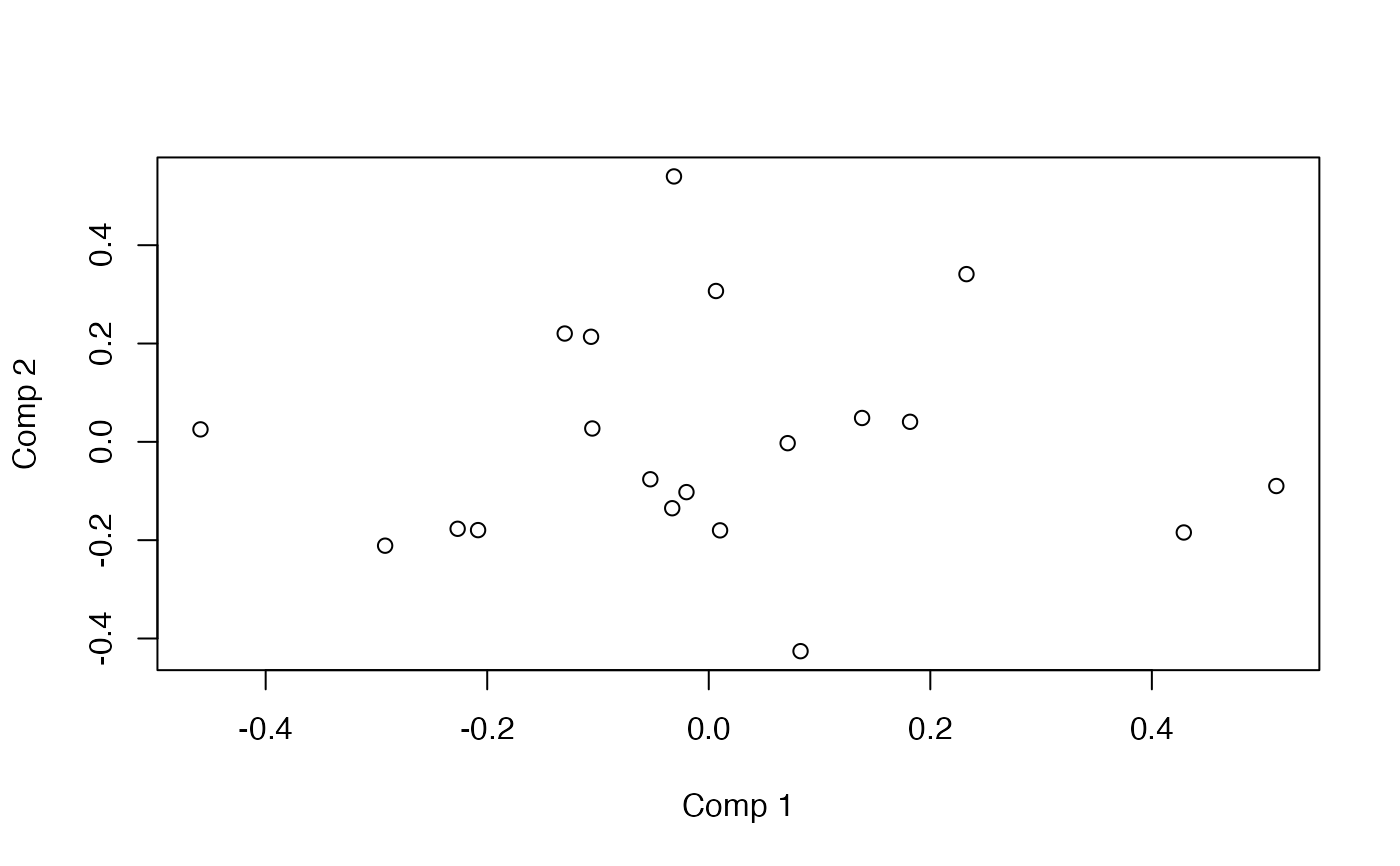
Plot individual scores
Usage
plot_pls_individuals(
  object,
  comps = c(1L, 2L),
  labels = NULL,
  groups = NULL,
  ellipse = TRUE,
  ellipse_level = 0.95,
  ellipse_n = 200L,
  group_col = NULL,
  ...
)
Arguments
- object
A fitted PLS model with scores.
- comps
Components to plot (length two).
- labels
Optional character vector of point labels.
- groups
Optional factor or character vector defining groups for individuals. When supplied, group-specific colours are used and, if
ellipse = TRUE, confidence ellipses are drawn for each group.- ellipse
Logical; draw group confidence ellipses when
groupsare provided.- ellipse_level
Confidence level for the ellipses (between 0 and 1).
- ellipse_n
Number of points used to draw each ellipse.
- group_col
Optional vector of colours for the groups. Recycled as needed.
- ...
Additional plotting parameters passed to
graphics::plot().