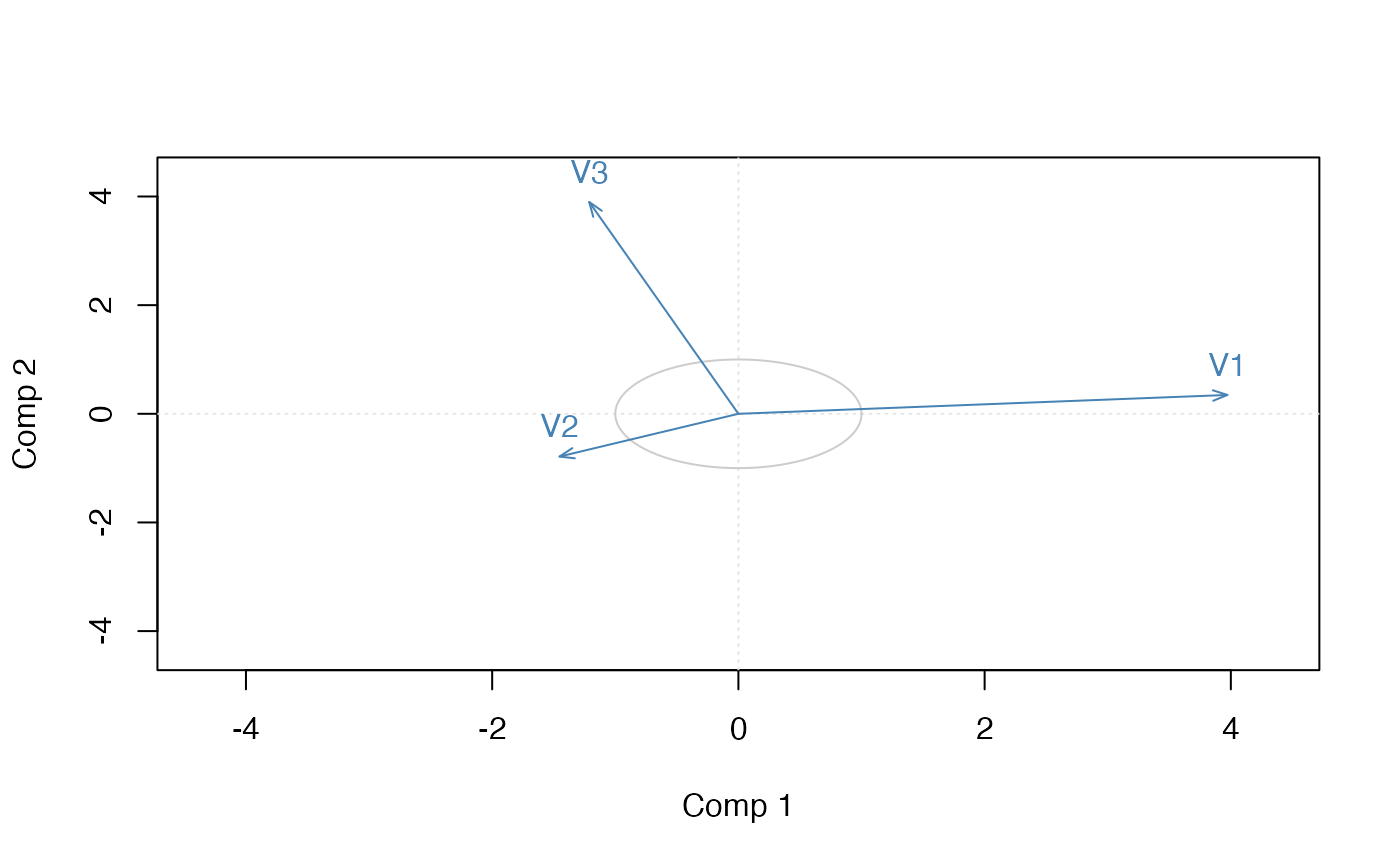
Plot variable loadings
Usage
plot_pls_variables(
  object,
  comps = c(1L, 2L),
  circle = TRUE,
  circle_col = "grey80",
  arrow_col = "steelblue",
  arrow_scale = 1,
  ...
)
Arguments
- object
A fitted PLS model.
- comps
Components to display (length two).
- circle
Logical; draw the unit circle.
- circle_col
Colour of the unit circle.
- arrow_col
Colour of the variable arrows.
- arrow_scale
Scaling applied to variable vectors.
- ...
Additional plotting parameters passed to
graphics::plot().