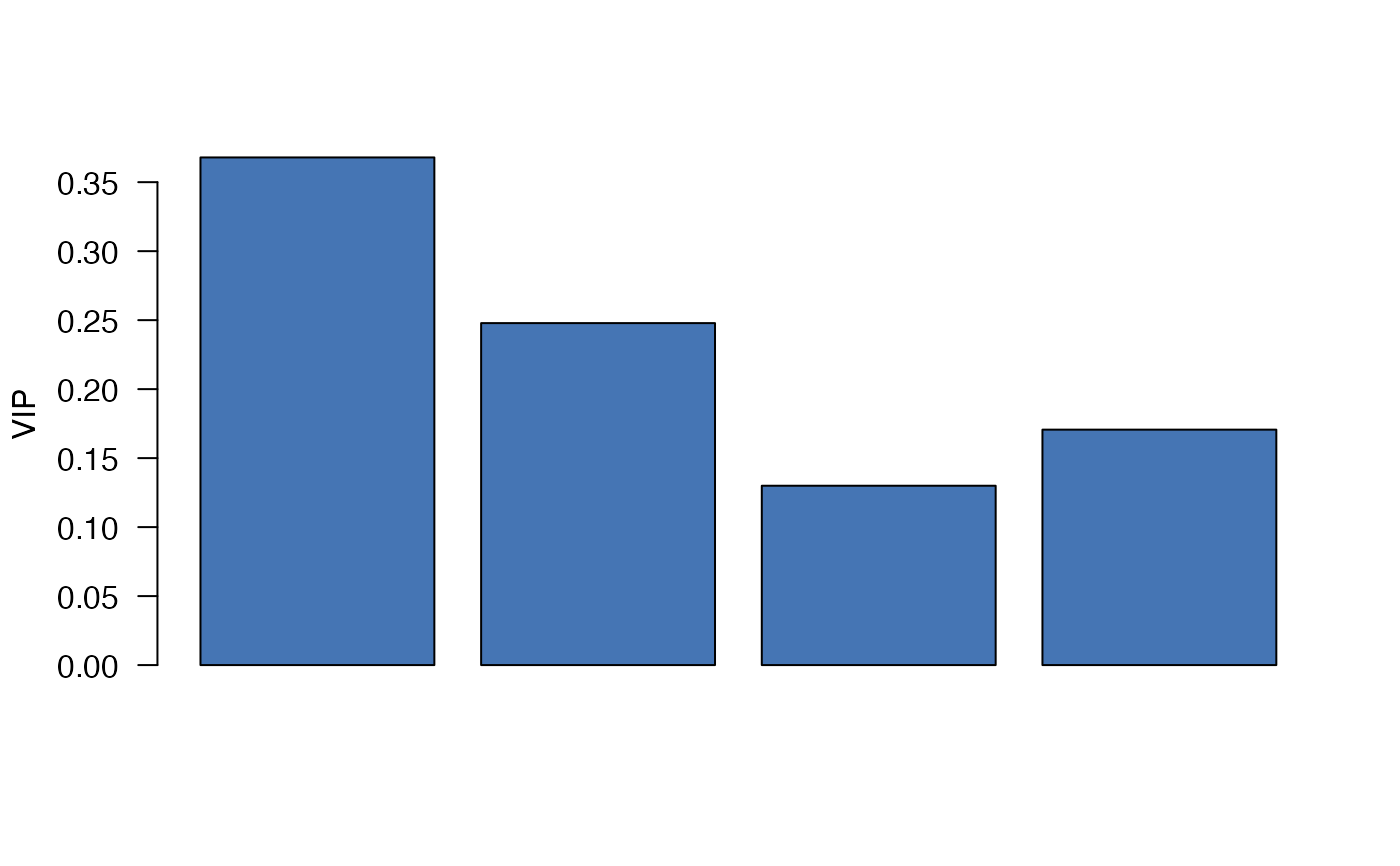
Plot Variable Importance in Projection (VIP)
Usage
plot_pls_vip(
  object,
  comps = NULL,
  threshold = 1,
  palette = c("#4575b4", "#d73027"),
  ...
)
Arguments
- object
A fitted PLS model.
- comps
Components to aggregate. Defaults to all available.
- threshold
Optional threshold to highlight influential variables.
- palette
Colour palette used for bars.
- ...
Additional parameters passed to
graphics::barplot().