Plot method for table of summary of cross validated plsRglm models
Source:R/plot.table.summary.cv.plsRglmmodel.R
plot.table.summary.cv.plsRglmmodel.RdThis function provides a table method for the class
"summary.cv.plsRglmmodel"
References
Nicolas Meyer, Myriam Maumy-Bertrand et Frédéric Bertrand (2010). Comparing the linear and the logistic PLS regression with qualitative predictors: application to allelotyping data. Journal de la Societe Francaise de Statistique, 151(2), pages 1-18. https://ojs-test.apps.ocp.math.cnrs.fr/index.php/J-SFdS/article/view/47/
Author
Frédéric Bertrand
frederic.bertrand@lecnam.net
https://fbertran.github.io/homepage/
Examples
data(Cornell)
bbb <- cv.plsRglm(Y~.,data=Cornell,nt=10,NK=1,
modele="pls-glm-family",family=gaussian(), verbose=FALSE)
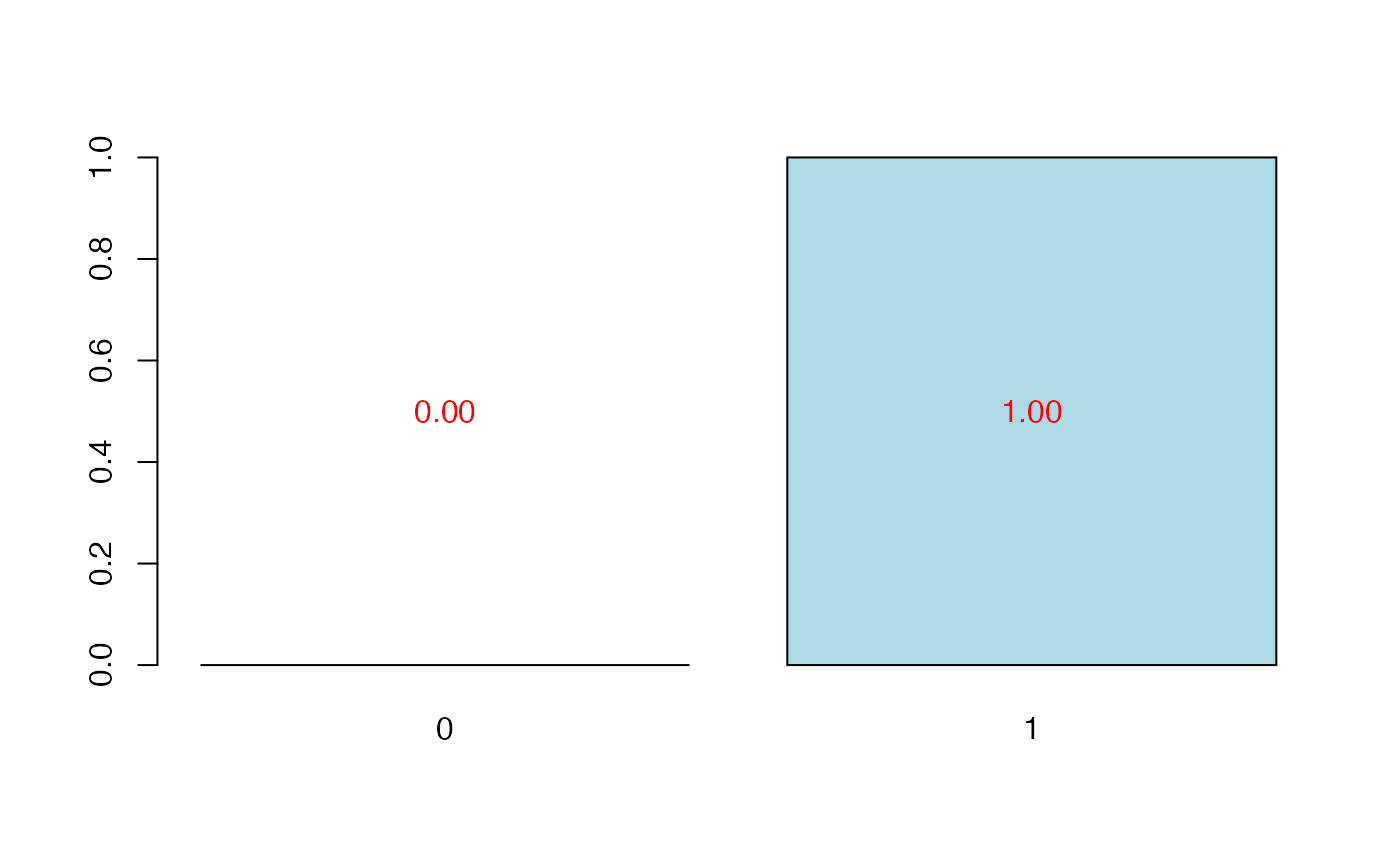
plot(cvtable(summary(bbb,verbose=FALSE)),type="CVQ2Chi2")
#>
#> CV Q2Chi2 criterion:
#> 0
#> 0
#>
#> CV PreChi2 criterion:
#> 1
#> 0
 rm(list=c("bbb"))
# \donttest{
data(Cornell)
plot(cvtable(summary(cv.plsRglm(Y~.,data=Cornell,nt=10,NK=100,
modele="pls-glm-family",family=gaussian(), verbose=FALSE),
verbose=FALSE)),type="CVQ2Chi2")
#>
#> CV Q2Chi2 criterion:
#> 0
#> 0
#>
#> CV PreChi2 criterion:
#> 1
#> 0
# }
rm(list=c("bbb"))
# \donttest{
data(Cornell)
plot(cvtable(summary(cv.plsRglm(Y~.,data=Cornell,nt=10,NK=100,
modele="pls-glm-family",family=gaussian(), verbose=FALSE),
verbose=FALSE)),type="CVQ2Chi2")
#>
#> CV Q2Chi2 criterion:
#> 0
#> 0
#>
#> CV PreChi2 criterion:
#> 1
#> 0
# }